
Fig 2. Quantitative evaluation.
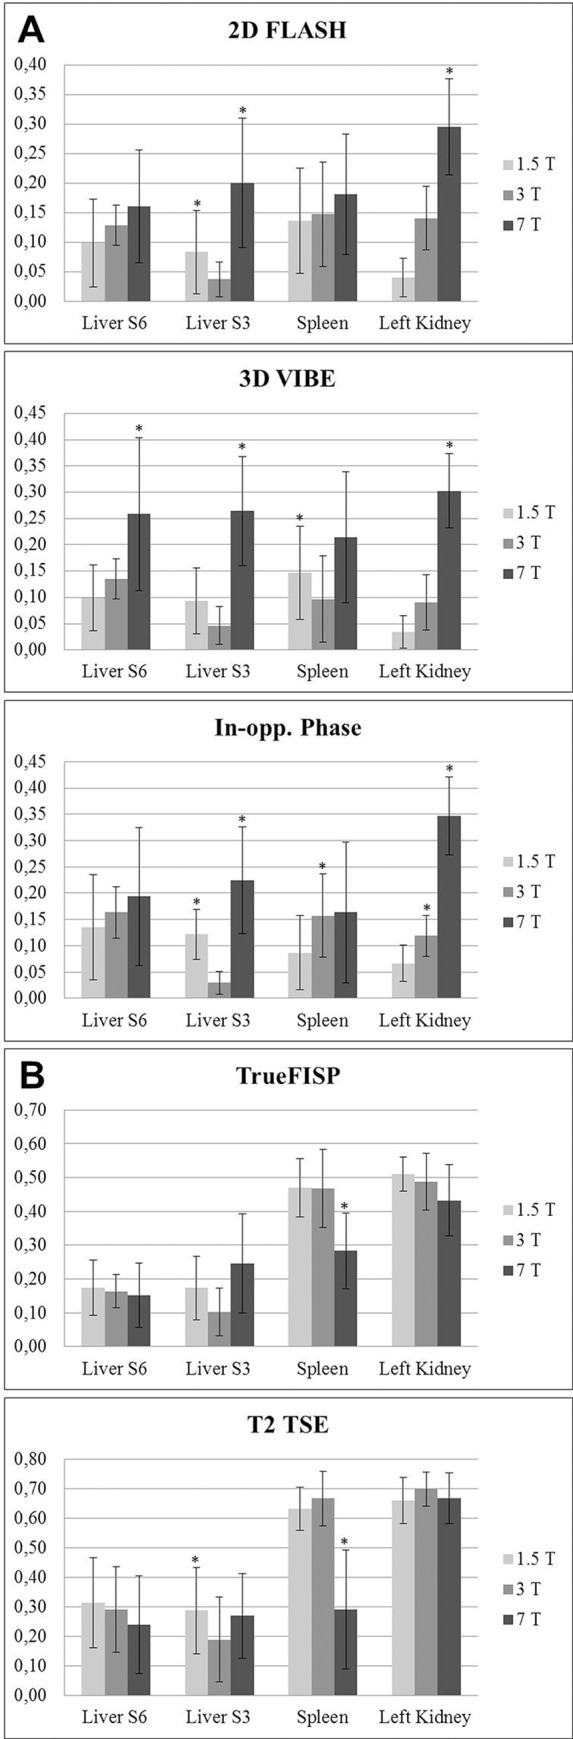
(A) Quantitative analysis showing contrast ratios of different parenchymatous organs to the ipsilateral psoas muscle for the T1-weighted sequences. * indicates statistical significance (p value < 0.05).(B) Quantitative analysis showing contrast ratios of different parenchymatous organs to the ipsilateral psoas muscle for TrueFISP and T2-weighted TSE sequence. * indicates statistical significance (p value < 0.05).