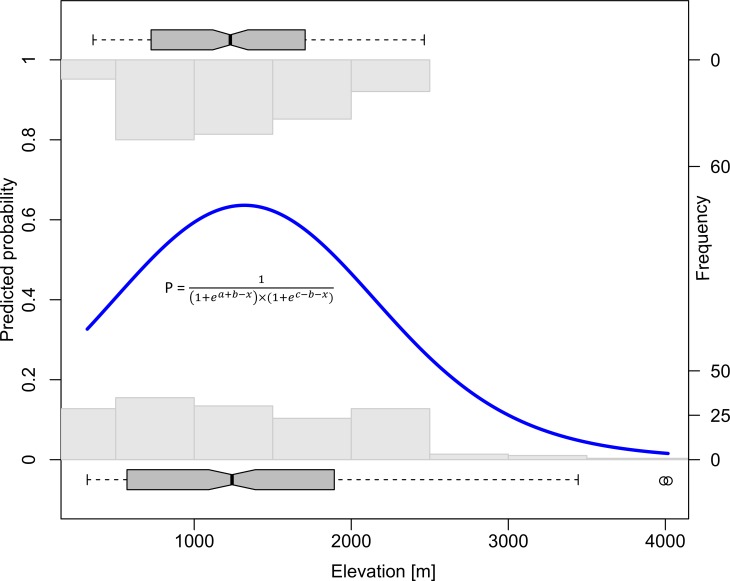
Fig 2. The probability of occurrence of invasive Ageratina adenophora along an elevational gradient in Western Himalaya shows a unimodal relationship with elevation.
The bold blue line represents the predicted probability of occurrence from the model having best fit (according to the AICc values) out of the seven hierarchical models used [61]. The equation in the figure shows the function for calculating the probability of occurrence where x is the elevation (predictor) and a, b, c are parameters of the model that are estimated by maximum likelihood procedure. The marginal histograms on the top and bottom of the plot show the frequency of presences and absences respectively, while the marginal boxplots depict the spread of presences and absences along the elevational gradient.

