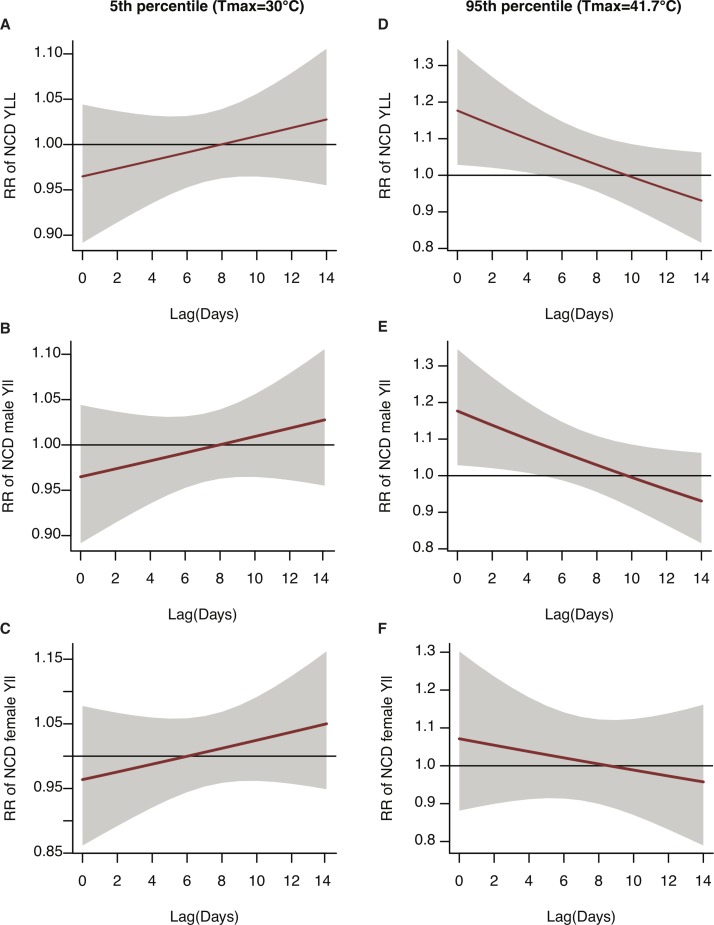
Figure 3.
Delayed effects of maximum temperature on the RR of NCD-YLL (solid line) and 95% confidence bounds (grey area) for all ages, men and women in Nouna, Burkina Faso, by lag 0–14 days. Plots (A) all ages, (B) male and (C) female represent cold effects at 30°C (5th percentile), and plots (D) all ages, (E) male and (F) female represent heat effects at 41.7°C (95th percentile) of maximum temperature. The reference temperature is 36.4°C. Note: To improve legibility of the curves, the scales on the y-axis differ. NCD, non-communicable disease; RR, relative risk; YLL, years of life lost.

