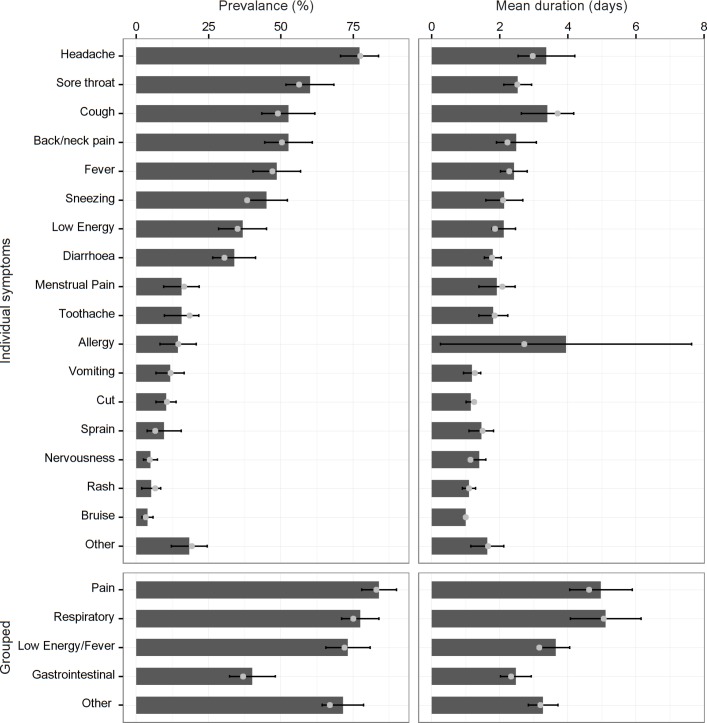
Figure 1.
Prevalence of symptoms and symptom groups adjusted for age and gender in Pakistan (left panels); and adjusted mean duration of a symptom for people experiencing that symptom/symptom group (right panels). Error bars represent 95% CIs (allergy symptoms were experienced by a small number of participants, with higher variability producing a noticeably wider CI). Grey points represent unadjusted values.

