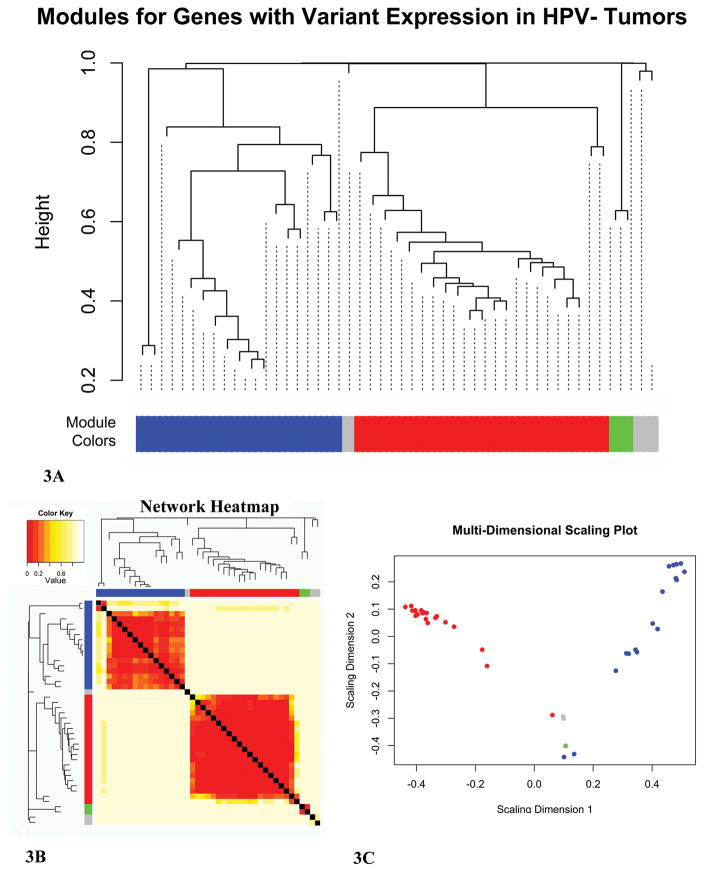
Figure 3. Weighted Gene Co-Expression Network (WGCNA) Construction.
Network construction using the WGCNA R package33. A. TOM-based dissimilarity cluster dendrogram of genes with high expression variation in 19 Human Papillomavirus negative (HPV−) tumors from smokers. Gene clusters are assigned to colored modules (blue, grey, red, and green). B. Heatmap representation of the clusters with module colors. Dark red signifies high network overlap between two genes. C. Multi-dimensional scaling visualization of the colored modules. Scattered modules represent strong co-expression networks. Ends of the scattered modules represent hub genes (i.e. the genes with the most connections).

