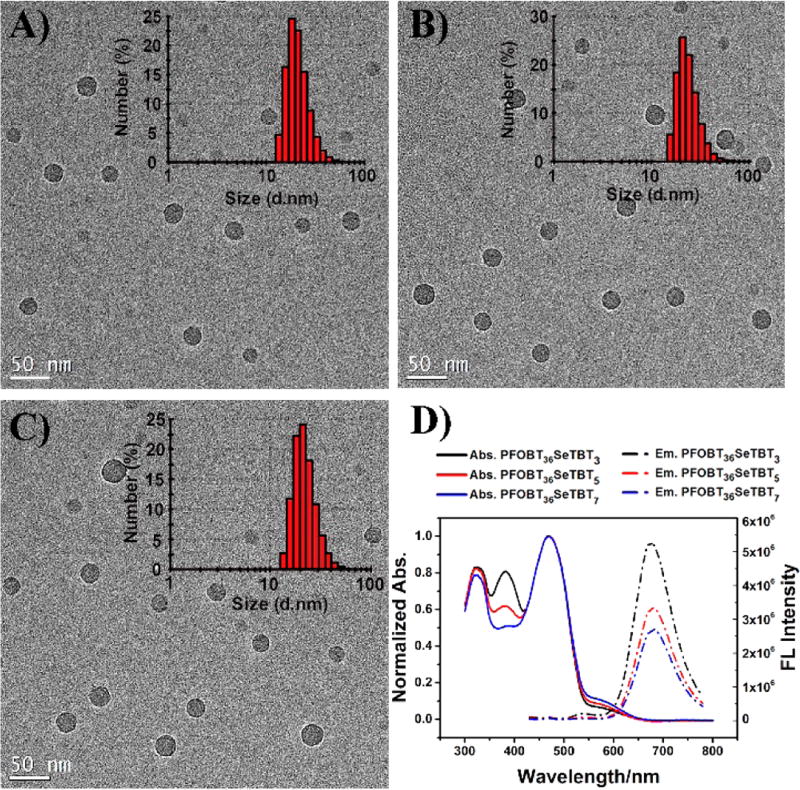
Figure 1.
Size and optical characterization of PFOBT36SeTBTx Pdots. High-resolution TEM images of PFOBT36SeTBT3 Pdots (A), PFOBT36SeTBT5 Pdots (B), and PFOBT36SeTBT7 Pdots (C) (insets: DLS size distribution histograms of PFOBT36SeTBTx Pdots). (D) Normalized absorption (Abs., solid line) and emission (Em., dashed line) spectra of PFOBT36SeTBTx Pdots recorded at the concentration of 10 µg/mL in water (black line: PFOBT36SeTBT3 Pdots, red line: PFOBT36SeTBT5 Pdots, and blue line: PFOBT36SeTBT7 Pdots).

