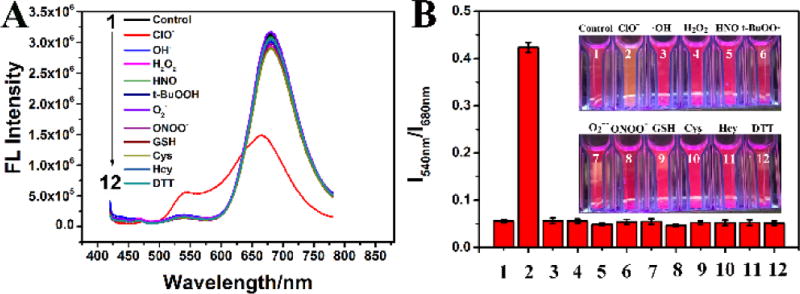
Figure 3.
Fluorescence spectra (A) and fluorescence intensity ratio (B) of PFOBT36SeTBT5 Pdots in the presence of various ROS and biologically relevant analytes: (1) PBS, (2) 100 µM ClO−, (3) 1 mM •OH, (4) 1 mM H2O2, (5) 1 mM HNO, (6) 1 mM t-BuOO•, (7) 1 mM O2−•, (8) 1 mM ONOO−, (9) 1 mM GSH, (10) 1 mM Cys, (11) 1 mM Hcy, and (12) 1 mM DTT. Insets in (B) show the photos of PFOBT36SeTBT5 Pdots with the addition of various ROS and biologically relevant analytes taken under illumination with a UV light at 365 nm.

