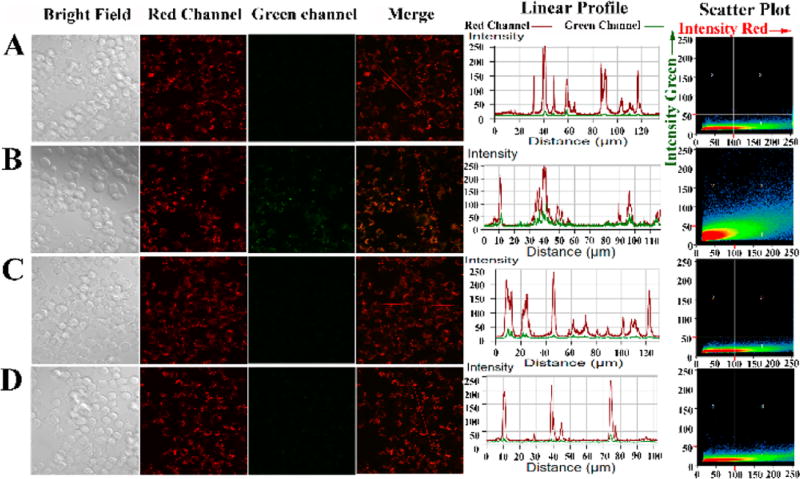
Figure 6.
Confocal fluorescence imaging of endogenous ClO− in stimulated RAW 264.7 macrophages incubated with PFOBT36SeTBT5 Pdots (10 µg/mL, 4 h) before imaging: (A) nontreated cells; (B) cells successively treated with LPS (4 h) and PMA (0.5 h); (C) cells pretreated with NAC 2 h before treated with LPS (4h) and PMA (0.5 h), followed with NAC for 1 h; and (D) cells pretreated with ABAH 2 h before treated with LPS (4 h) and PMA (0.5 h), followed with ABAH for 1 h. [LPS] = 1 µg/mL; [PMA] = 5 µg/mL; [NAC] = 1 mM; [ABAH] = 1 mM. Green channel at 530–600 nm; far-red channel at >650 nm.

