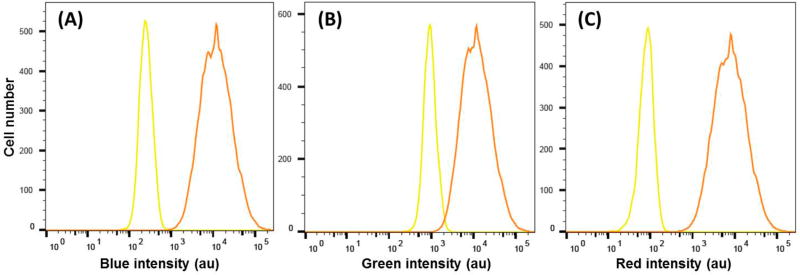
Figure 3.
Flow cytometry measurements of the fluorescence intensity distributions of MCF-7 breast cancer cells labeled via endocytosis using the Pdot barcode (333): (A) blue, (B) green, and (C) red channel. Cells without Pdots were used as a control (yellow curve). The excitation wavelength was at 405 nm; blue, green, and red fluorescence were collected through the band-pass of 450/50, 525/50, and 670/30 nm, respectively.

