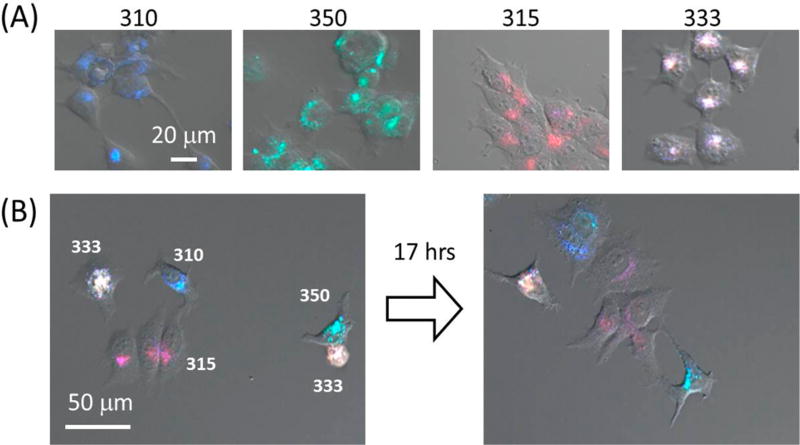
Figure 5.
(A) Combined Nomarski and confocal fluorescence microscopy images of MCF-7 cells labeled with four different Pdot barcodes: Pdot 310, Pdot 350, Pdot 315, and Pdot 333 (from left to right). The fluorescence image is the color overlay of blue, green, and red fluorescence channels. (B) Time-lapse fluorescence imaging of a mixture of MCF-7 cells labeled with four Pdot barcodes as shown in (A). The numbers next to the cells indicate the name of the labeled Pdot barcodes. The time course of the monitoring lasted for 17 h. The blue, green, and red fluorescence were recorded through band-pass filters of 440/40 and 525/40 nm and a 650 nm long-pass filter, respectively, with excitation from a 405 nm laser (30 mW, 20% transmission).

