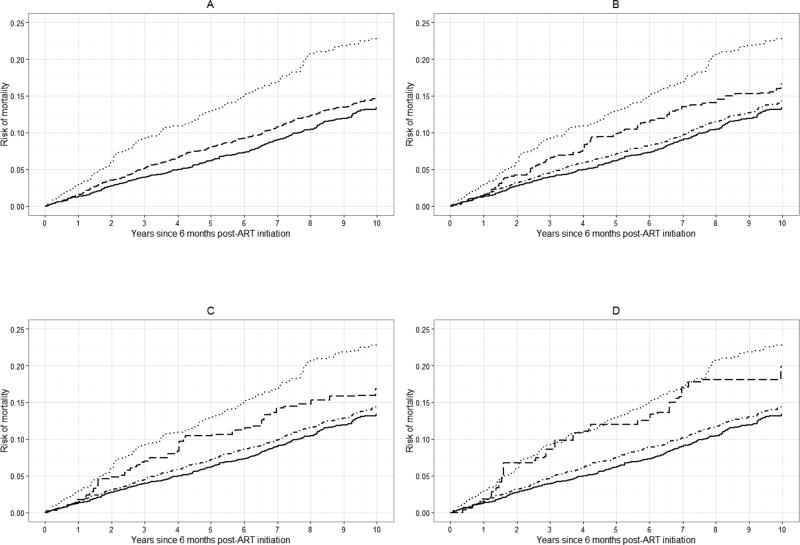
Figure 3.
Standardized risk curves for all-cause mortality for 7,944 CNICS patients, for selected viral load threshold values of k, stratified by viral load category, averaged over 100 imputations. Standardized estimates controlled for age, sex, race/ethnicity, male-to-male sexual contact, injection drug use, smoking, at-risk alcohol use, pre-ART viral load, year of ART initiation, ART regimen, CD4 count, clinical AIDS status, status of other clinical conditions (chronic hepatitis B, chronic hepatitis C, past diagnosis of any cancer excluding nonmelanoma skin cancer), statin use, and study site. Solid line represents viral loads <20 copies/mL, dot-dashed line represents viral loads between 20 and k copies/mL, dashed line represents viral loads between k and 999 copies/mL, dotted line represents viral loads >999 copies/mL. A. k = 20 copies/mL; B. k = 130 copies/mL; C. k = 200 copies/mL; D. k = 400 copies/mL.

