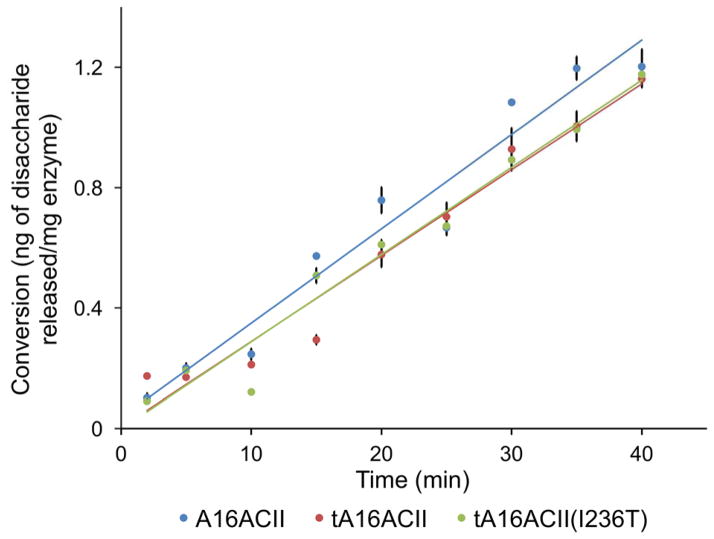
Figure 5.
This figure graphically shows the change in mass of disaccharide released (ng) per mg of enzyme in reactions consisting of 5 μL of 1 mg/mL CS-A, 93 μL of digestion buffer, and 2 μL of ~5 μg/mL of tA16ACII, tA16ACII(I236T), or A16ACII enzyme. The reactions were thermally inactivated and processed for disaccharide analysis after for 0, 2, 5, 10, 15, 20 min, etc., for up to 40 min, as shown on the x-axis labels. Each reaction was run in duplicate and the average disaccharide content at each time point was plotted on the y-axis. The linear equations derived from these plots are: y = 0.0286x +0.0028 (for tA16ACII); y = 0.029x – 0.0027 (for tA16ACII(I236T)); y = 0.0314 + 0.0353 (for A16ACII).

