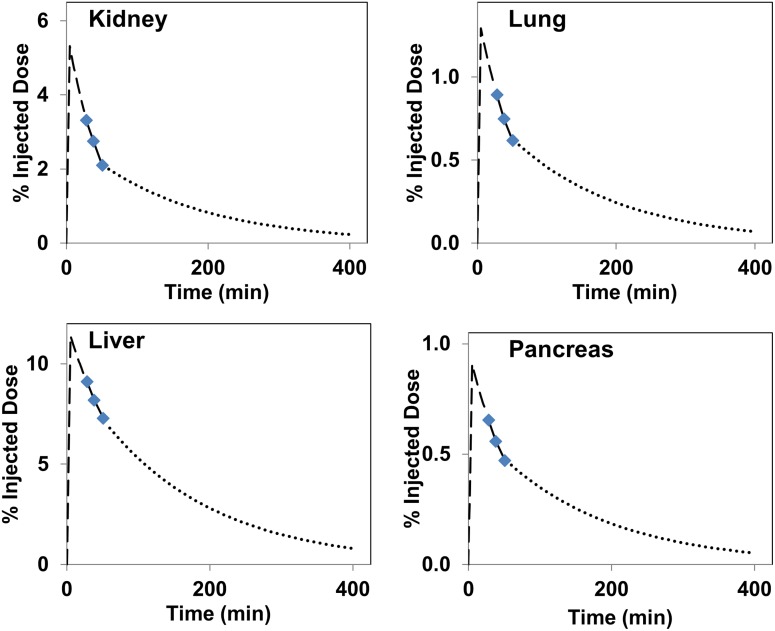
Fig 4. The time activity curves generated by fitting an expontial function to the PET data for the pancreas, liver, and kidneys.
The initial portion of the curve (prior to 20 min PET scan value) was modeled to fit to a peak uptake at 5 min. The time activity curve past the 40 min scan measured value was assumed to be depleted only by the physical decay of F-18 radionuclide.

