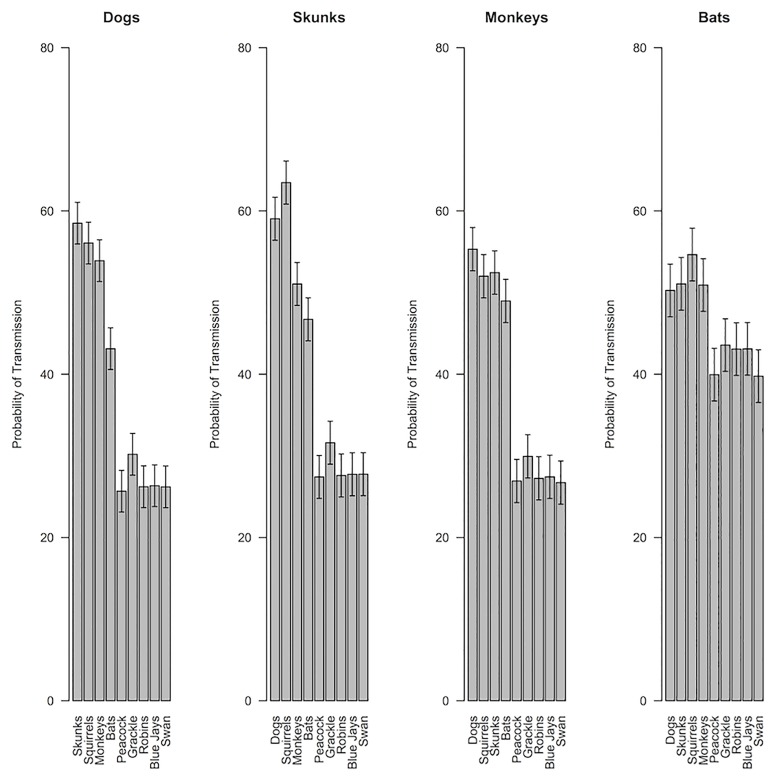
Fig 4. Subjective probabilities of mammal disease transmission.
Subjective probabilities of disease transmission between each premise animal and conclusion animal for mammal premise categories. Graphs are separated by premise category. The bars reflect different conclusion categories. Thus, the first bar in the first graph is the mean perceived likelihood of a dog disease being transmitted to a squirrel. Error bars represent 95% confidence intervals calculated from separate linear mixed effects models examining how species-to-species disease transmission beliefs varied for each of the premise mammals.

