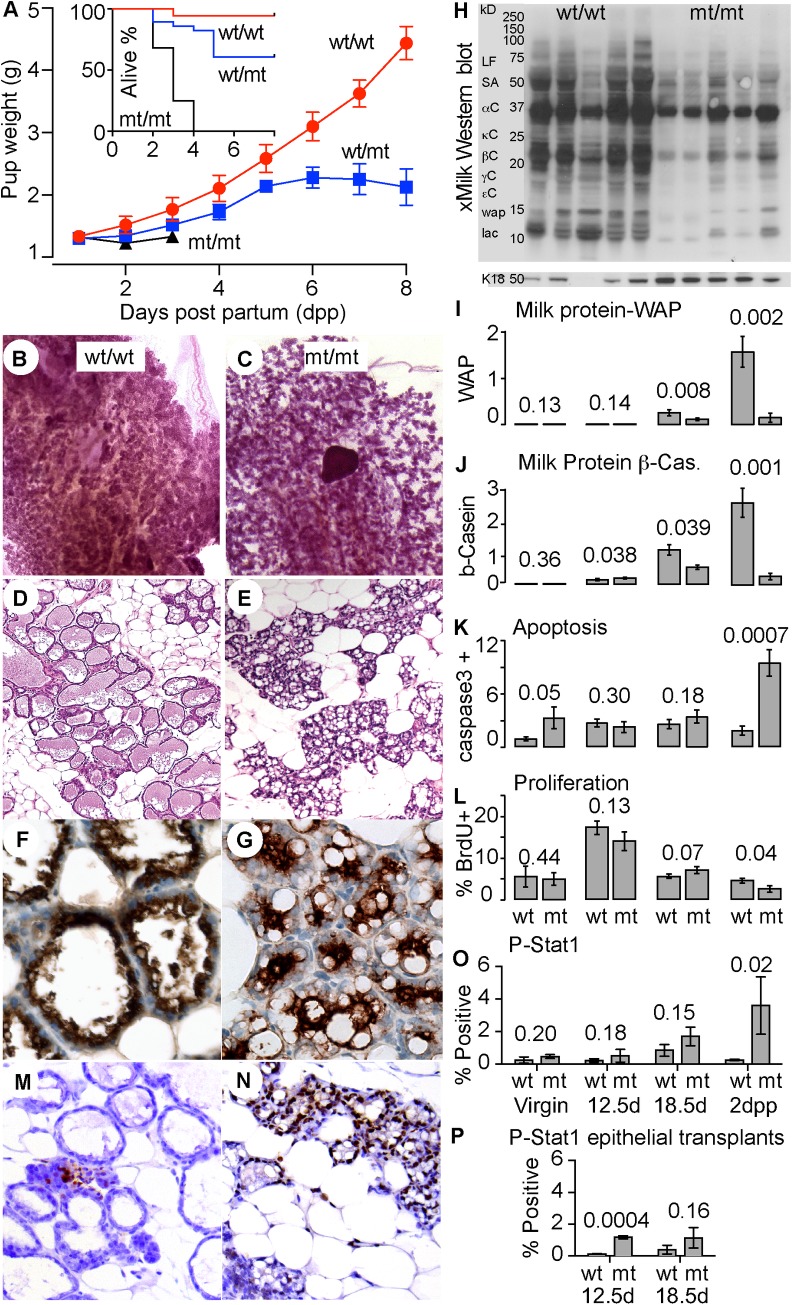
Fig 1. Discovery of a pedigree with dominant inheritance of failed lactation.
(A) Lactation performance of dams of the indicated genotypes (wild type; wt/wt mutant; mt/mt) assessed by pup weight-gain or survival (inset). Error bars show standard error of the mean for 4–5 litters per genotype of 7 pups each. wt/wt n = 35, wt/mt n = 28 and mt/mt n = 28 pups. (B and C) Whole mount histology of the 4th inguinal mammary gland showing lobuloalveolar development at 2 days post partum (dpp) in wt/wt or mt/mt mice. (D and E) Corresponding haematoxylin-eosin histochemistry. (F and G) Corresponding immunohistochemistry for milk protein expression. (H) Corresponding Western blot for milk proteins. Molecular size is shown together with the established sizes of the indicated milk proteins [35]. Lactoferrin (LF), serum albumin (SA), caseins α,κ,β,γ and ε, whey acidic protein (wap) and alpha lactalbumin (lac). (I) Quantification of Wap mRNA by qPCR at in wt/wt or mt/mt mice. (J) Quantification of β-casein (β-Cas) mRNA by qPCR. (K) Quantification of epithelial cell death by immunohistochemistry for cleaved caspase 3, results are the number of positively stained epithelial cells as a percentage as a percentage of total number of epithelial cells per field. (L) Quantification of epithelial cell proliferation by incorporated BrdU expressed as a percentage of total number of epithelial cells per field. (M and N) immunohistochemistry for phosphorylated (P) STAT1 at 2 days post partum (dpp) in wt/wt or mt/mt mice. (O) quantification of P-STAT1 in wt/wt or mt/mt mice by immunohistochemistry, results are the number of positively stained epithelial cells as a percentage of total epithelial area. (P) Quantification of P-STAT1 in wt/wt or mt/mt mammary transplants by immunohistochemistry, results are the number of positively stained epithelial cells as a percentage of total epithelial area. (I-J and O) wt/wt n = 4–5 mice, mt/mt n = 3–5 mice per time point (P) wt/wt n = 3–5 mice, mt/mt n = 2–5 per time point. Student’s t-test p values are given, error bars are standard error of the mean.

