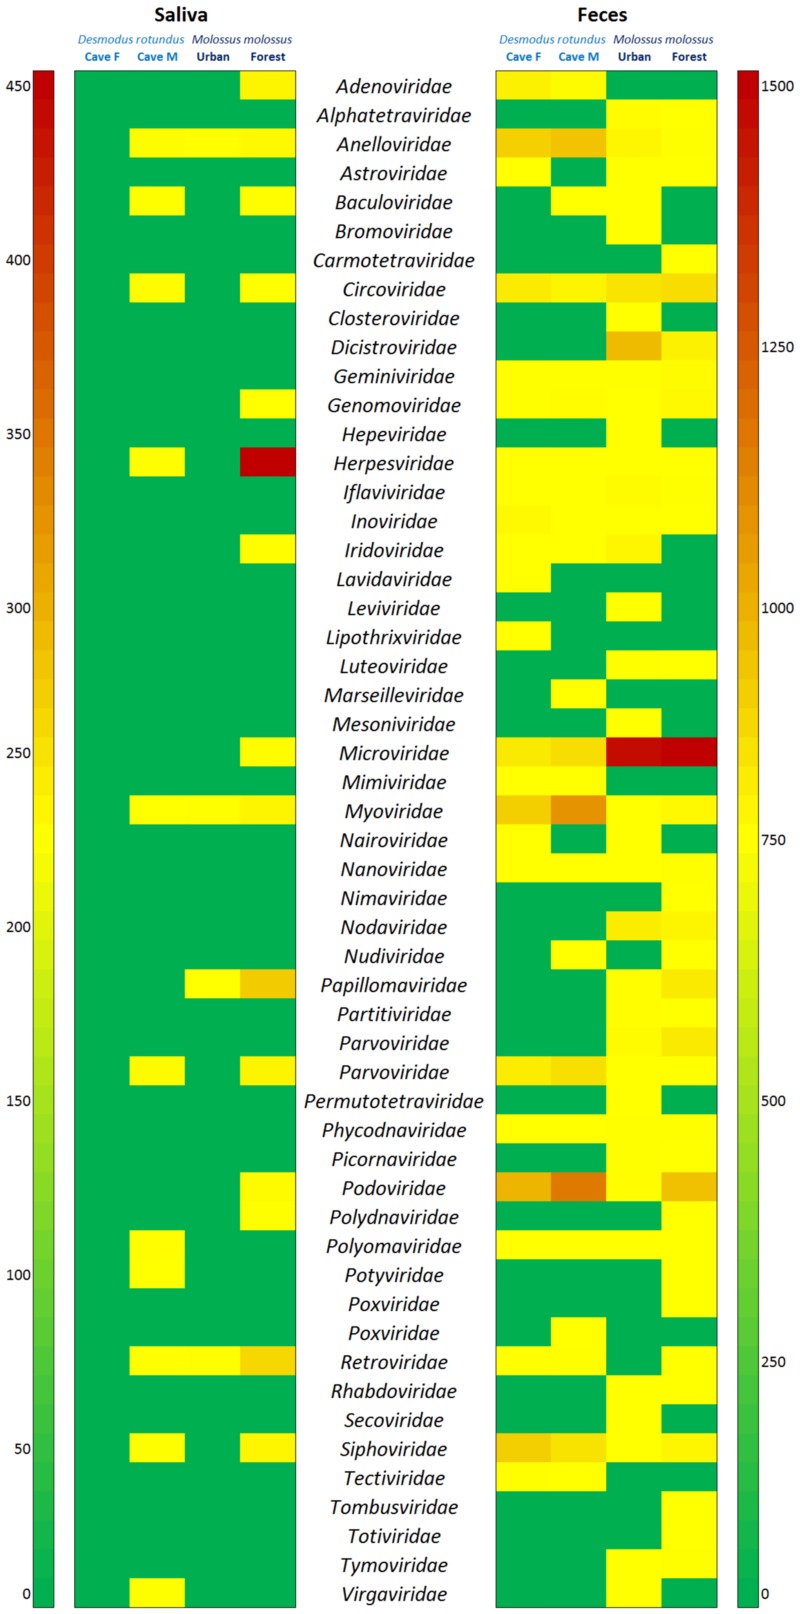
Fig 2. Heatmap based on the viral-associated contigs of 51 families of insect, phage, plant/protozoan and vertebrate viruses in each pooled sample.
Location information is provided above each column (Caves F and M for D. rotundus, Urban and Forest for M. molossus). The names of the viral families are presented in alphabetical order in the middle. The boxes colored from green to dark red represent the number of contigs observed. Contigs varied between 1 and 450 for the saliva samples and between 1 and 1465 for feces. The scales are given for each type of sample.

