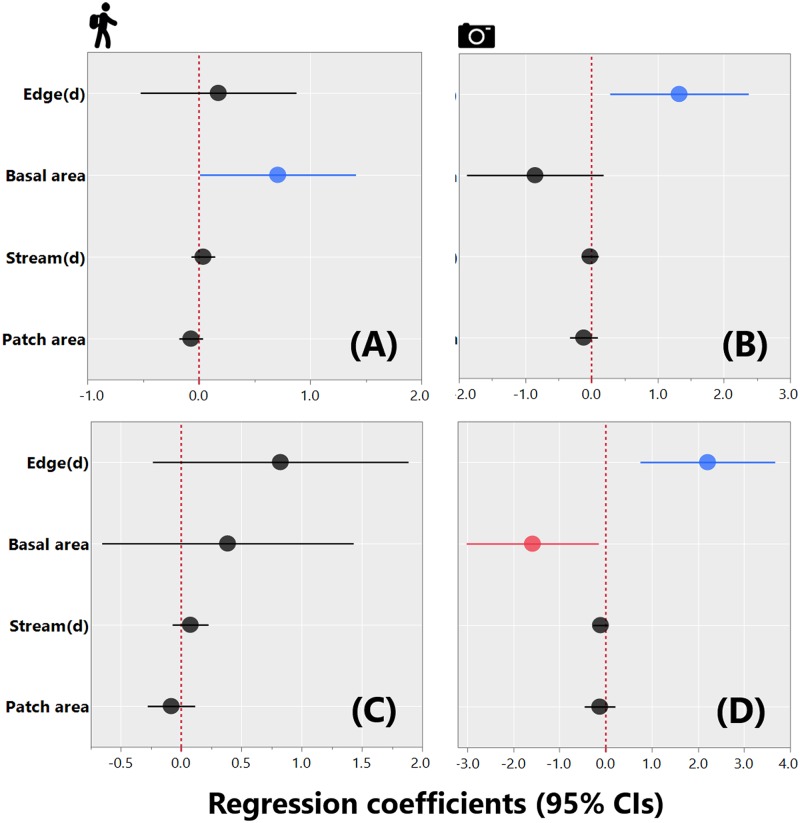
Fig 6. Coefficient estimates (± 95% confidence intervals) showing the magnitude and direction of effects of different explanatory variables.
Effects of different explanatory variables considering either the line transect census data (A, C) or camera trapping data (B, D). Top panels (A, B) show effect sizes for species richness; bottom panels (C, D) show effect sizes for overall abundance. Explanatory variables included Edge(d): distance to the nearest edge between primary forest and adjacent oil palm plantation; Basal area of native vegetation; Stream(d): distance to the nearest perennial stream; and Patch area: size of any given habitat patch (in ha).

