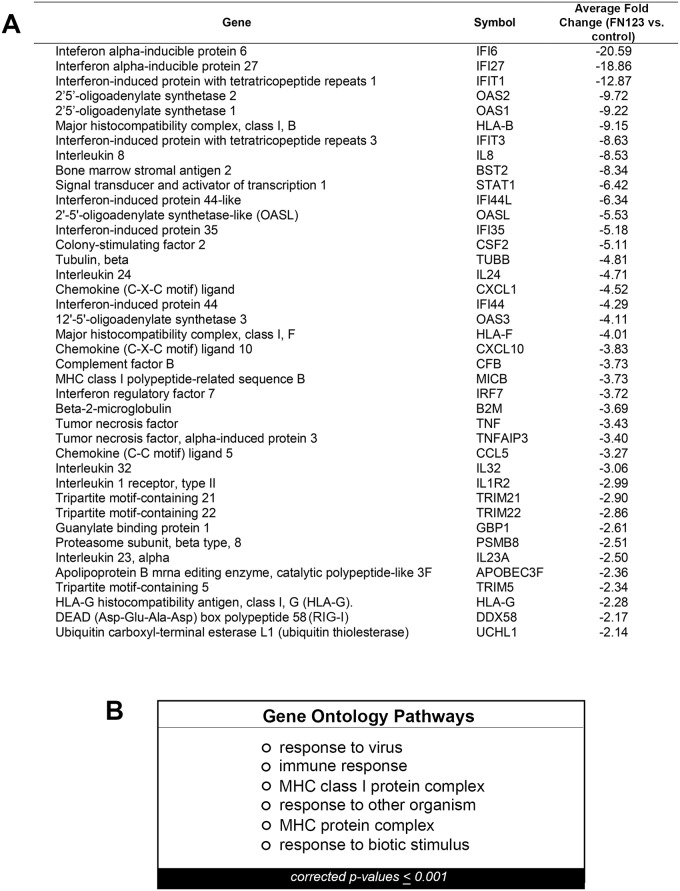
Fig 2. Genes and pathways decreased in 16E6/FN123 HFKs.
(A) A subset of the over 200 genes that were decreased in 16E6/FN123 cells compared to 16E6/control. Fold change shown is the average fold change over all 16E6 HFK cell lines in which that gene was decreased. (B) Microarray data were analyzed using GeneSpring GX11.5.1, and the significant Gene Ontology pathways for the collection of genes decreased in two out of three 16E6 HFK cell lines were found. Only pathways with a p-value ≤ 0.001 are shown.

