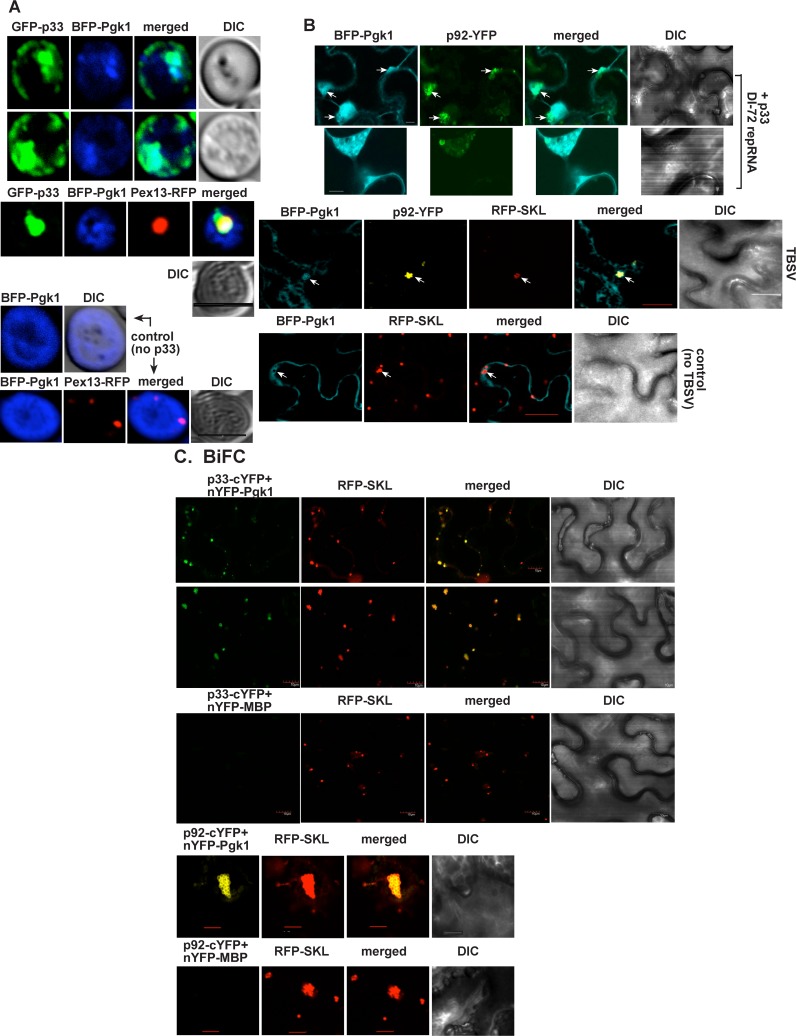
Fig 2. Recruitment of Pgk1 into the viral replication compartment in yeast and plant cells.
(A) Confocal laser microscopy images show the partial co-localization of TBSV GFP-tagged p33 with the BFP-tagged Pgk1 protein in wt yeast cells. DIC (differential interference contrast) images are shown on the right. Bottom images show the expected cytosolic distribution of BFP-Pgk1 in the absence of viral components in a wt yeast cell. Pex13-RFP is expressed as a peroxisomal marker in experiments presented as the third and fifth panels. Scale bars represent 5 μm. (B) Confocal laser microscopy shows partial co-localization of TBSV YFP-tagged p92pol replication protein with the BFP-NbPgk1 protein in N. benthamiana cells. Expression of the above proteins together with the untagged p33 and the DI-72 RNA from the 35S promoter was achieved after co-agroinfiltration of N. benthamiana leaves. The large structures represent the viral replication compartments. Bottom image: in the control experiment, the BFP-NbPgk1 protein shows the expected cytosolic distribution in the absence of viral components in N. benthamiana cells. Scale bars represent 5 μm (second panel), 10 μm (top panel), and 20 μm (bottom two panels), respectively. (C) Top two panels: In planta interaction between of TBSV p33-cYFP replication protein and the nYFP-NbPgk1 protein. Expression of the above proteins from the 35S promoter was done after co-agroinfiltration into N. benthamiana leaves. Note that p33-cYFP and the nYFP-NbPgk1 proteins were detected by BiFC. The interaction between p33 replication protein and NbPgk1 occurs in the replication compartment decorated by RFP-SKL (peroxisomal luminar marker). Third panel: control BiFC experiments included nYFP-MBP protein in combination with p33-cYFP (bottom panel). Fourth panel: In planta interaction between TBSV p92-cYFP replication protein and the nYFP-NbPgk1 protein. Fifth panel: control BiFC experiments included nYFP-MBP protein in combination with p92-cYFP. Scale bars represent 10 μm (top three panels), and 20 μm (bottom two panels), respectively.

