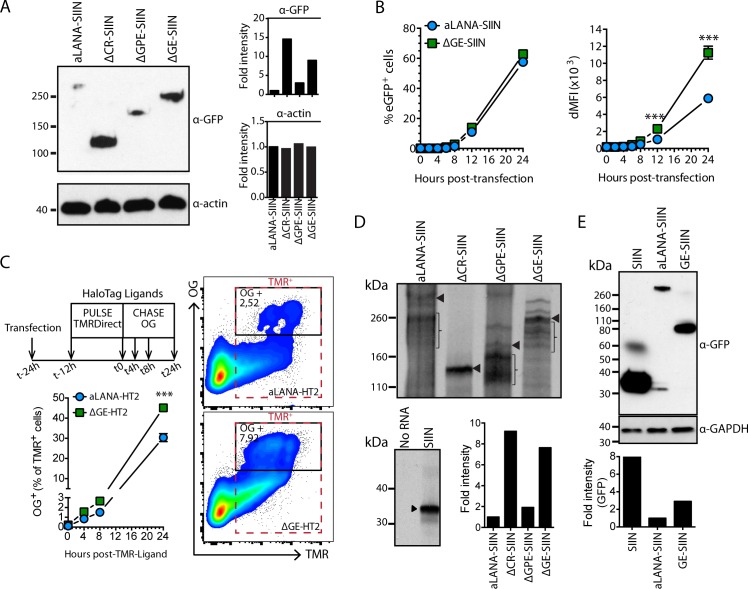
Fig 7. The GE-rich domain reduces protein synthesis efficiency of aLANA.
(A) Immunoblot analysis of expression of aLANA-, ΔCR-, ΔGPE- and ΔGE-SIIN. 293Kb cells were transfected with the indicated plasmids and immunoblot performed at 48h after transfection. Duplicate blots were probed with either HRP-anti-GFP monoclonal antibody to detect aLANA constructs or anti-actin monoclonal antibody as loading control. Band intensities from the immunoblot were quantified by densitometry analysis using ImageJ64 software. Data are representative of three independent experiments with similar results. (B) Flow cytometry analysis of eGFP median fluorescence intensities (MFI) at the indicated time points after transfection. The left panel shows percent of eGFP+ cells and the right panel shows deltaMFI (dMFI). dMFI were calcutated as [MFI of eGFP-positive population–MFI of eGFP-negative population]. (C) Halotag pulse-chase. Cells were transfected with aLANA- or ΔGE-HT2 constructs and pulsed 12h later with HaloTag TMR-Direct Ligand overnight, extensively washed and chased for 24h. At the indicated time points, cells were incubated with cell-permeable HaloTag Oregon Green (OG) Ligand for 15 min before analysis by flow cytometry for detection of de novo protein expression. (D) Uncoupled in vitro transcription/translation assay of aLANA, ΔCR-, ΔGPE- and ΔGE-SIIN. The T7 promoter was first subcloned into the different peGFP-C1 constructs downstream the CMV promoter. The constructs were then transcribed in vitro with T7 RNA polymerase. Equimolar amounts of the resulting capped RNAs were then subjected to in vitro translation using rabbit reticulocyte lysate supplemented with [35S]-methionine. Intensities of the bands at the expected size obtained from immunoblotting in A were quantified by densitometry analysis using ImageJ64 software. Braces indicate radioactive signal from parasite bands. (E) Immunoblot analysis of SIIN, aLANA-SIIN, and GE-SIIN expression. 293Kb cells were transfected with the indicated plasmids and immunoblot performed at 24h after transfection. Duplicate blots were probed with either HRP-anti-GFP monoclonal antibody to detect aLANA constructs or anti-GAPDH monoclonal antibody as loading control. Band intensities from the immunoblot were quantified by densitometry analysis using ImageJ64 software. Data are representative of two independent experiments with similar results. Statistical analyses by two-way ANOVA and Sidak’s post-test (***p≤0.001).

