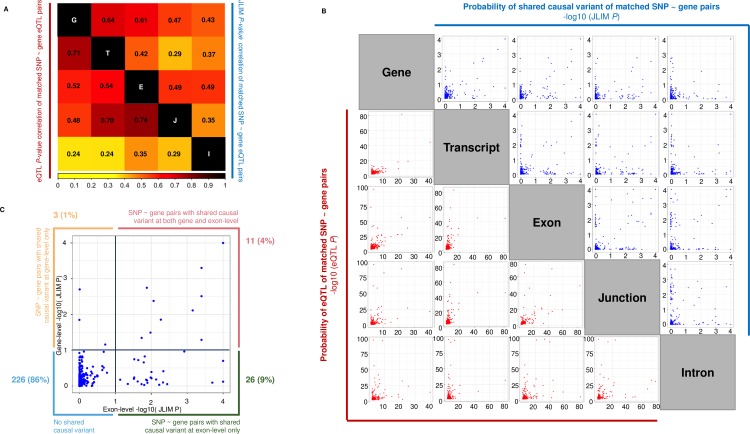
Fig 1. Pairwise comparison of cis-eQTL and JLIM P-values for matched SNP-gene pairs.
This figure is complementary to the data in Table 2 and is derived from cis-eQTL analysis of the 38 SLE associated SNPs using RNA-Seq and implementation of the JLIM method to assess evidence of a shared causal variant. (A) We measured the Pearson’s correlation separately of all cis-eQTL and JLIM P-values between matched SNP-gene cis-eQTL pairs across the five RNA-Seq quantification types. We only considered matched SNP-gene cis-eQTL association pairs that had a nominal cis-eQTL association P-value < 0.01 in both quantification types, and to be conservative, when multiple transcripts, exons, junctions, and introns were annotated with the same gene symbol, we selected the associations that minimized the difference in JLIM P-value between matched SNP-gene cis-eQTLs across RNA-Seq quantification types. Note the weak JLIM P-value correlation of matched transcript-level and junction-level cis-eQTLs suggesting they stem from independent causal variants. (B) Correlation plots of matches SNP-gene cis-eQTL pairs as described above (red: cis-eQTL P-value; blue: JLIM P-value). Note that JLIM P-values often aggregate on the axis rather than on the diagonal suggesting independent causal variants across different quantification types. (C) An example of the sensitivity of exon-level analysis relative to gene-level. The majority of nominally significant JLIM P-values (<0.01) for matched SNP-gene pairs are captured by exon-level analysis and concealed at gene-level (green box: 9%).

