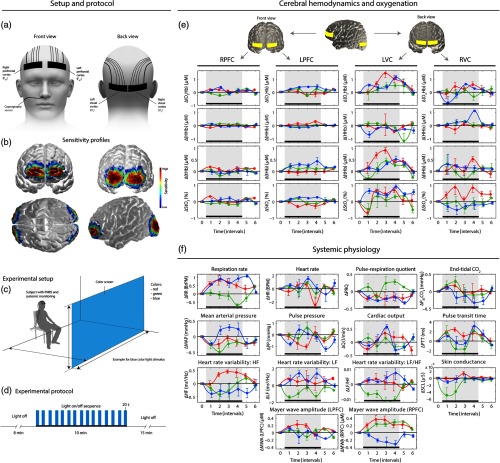
Fig. 1.
(a) Placements of the NIRS-optode (right and left PFC at positions Fp2 and Fp1; right and left VC at positions and ), (b) sensitivity profile of NIRS-sensors on the brain, (c) experimental setup with position of the subject and the color screen, and (d) experimental protocol. (e) and (f) Overview of the block-averaged (group-level) stimulus-evoked changes in cerebral hemodynamics/oxygenation and systemic physiology ( of the median). Black bar and gray area: time interval during visual stimulation.

