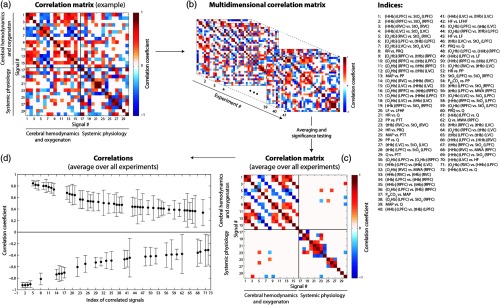
Fig. 2.
Visualization of the correlation analysis. (a) Exemplary correlation matrix of one subject and trial. (b) Combining the correlation matrices of each subject and trial results in a multidimensional correlation matrix. (c) Averaging these 3-D matrices generates the group-averaged correlation matrix. (d) Statistical analysis identifies the significant correlations shown here.

