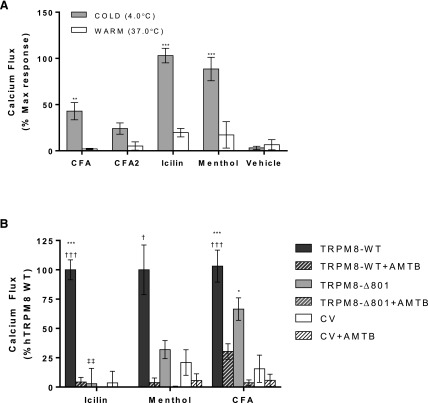
Fig. 1.
(A) Calcium flux in TRPM8-OE HEK-293 cells elicited by CFA and CFA2 (2.3 mg/ml per 180 μg/cm2; n = 8 and 8, respectively), icilin (20 μM; n = 10), and menthol (1 mM; n = 3) at 4 and 37°C. Data are represented as baseline and HEK-293 subtracted calcium flux, normalized to the maximum fluorescence change elicited by ionomycin (10 μM). Values are the mean ± S.E.M. Statistically significant responses relative to vehicle and warm treatments using two-way analysis of variance and post-testing using the Bonferroni multiple comparisons test are represented as **P < 0.01 and ***P < 0.001. (B) Calcium flux in GCaMP6s-overexpressing cells transfected with human TRPM8 wild type (WT; n = 16, 3, and 16 for icilin, menthol, and CFA, respectively), TRPM8-Δ801 (n = 3, 3, and 8 for icilin, menthol, and CFA, respectively), or the control vector (CV; pcDNA3.1/V5-His/lacZ; n = 13, 3, and 14 for icilin, menthol, and CFA, respectively) in response to icilin (20 µM), menthol (1 mM), and CFA (2.3 mg/ml per 180 μg/cm2) treatments. Inhibition of calcium flux by the TRPM8 antagonist AMTB at 20 μM (n = 16, 3, and 16 for full-length TRPM8, TRPM8-Δ801, and CV using icilin, menthol, and CFA, respectively) is shown for each treatment as pattern-filled bars. Values shown represent the mean ± S.E.M. Statistically significant responses using two-way analysis of variance and post-testing using the Bonferroni multiple comparisons test relative to CV are represented as ***P < 0.001, relative to AMTB represented as †P < 0.05 and †††P < 0.001, and relative to TRPM8-WT represented as ‡‡P < 0.001.

