Figure 1.
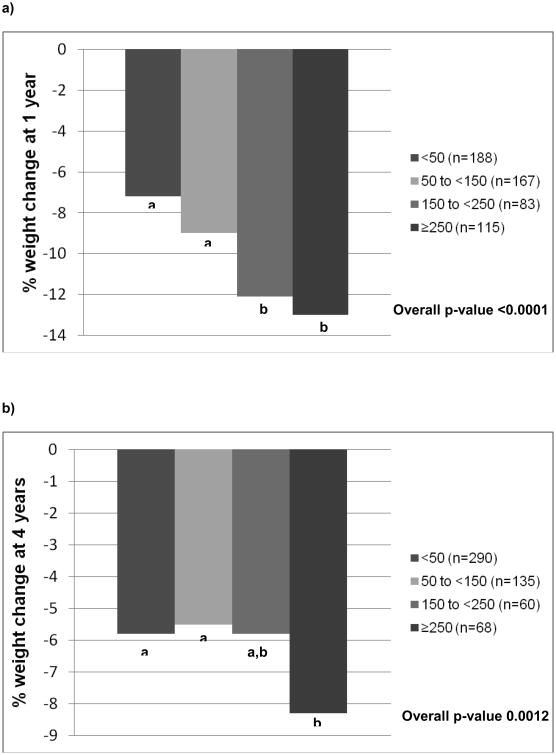
a: Percent weight change at 1 year, stratified by 1-year MVPA levels (Aim 1)
b: Percent weight change at 4 years, stratified by 4-year MVPA levels (Aim 2)
Physical activity categories based upon minutes/week of bout-related MVPA at Year 1 (a) and Year 4 (b). Overall p-value represents a group effect for categorized MVPA. Values with different superscripts indicate that groups are significantly different from one another. a. Percent weight change at 1 year, stratified by 1-year MVPA levels (Aim 1), b. Percent weight change at 4 years, stratified by 4-year MVPA levels (Aim 2)

