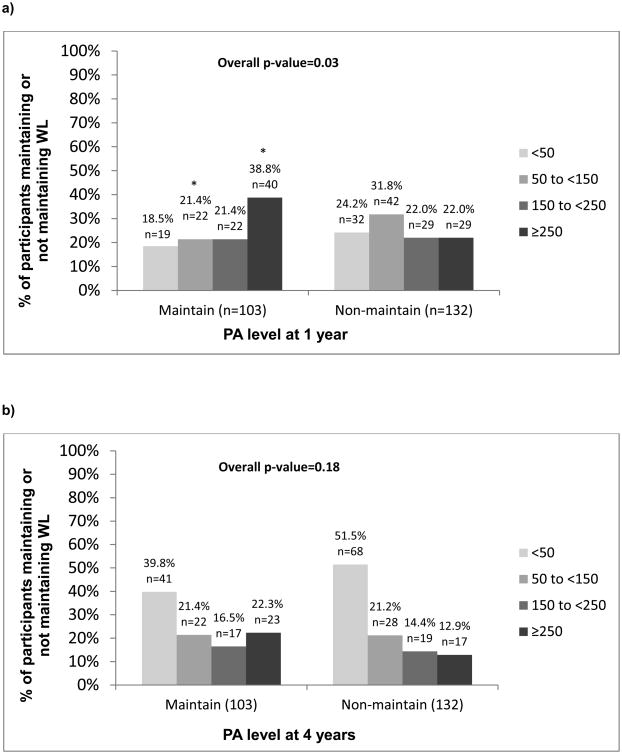
Figure 2.
a: Aim 3: Percentage of participants maintaining or not maintaining weight loss from years 1-4, stratified by MVPA levels at year 1
b: Aim 3: Percentage of participants maintaining or not maintaining weight loss from years 1-4, stratified by MVPA levels at year 4
Maintain: ≥10% weight loss at Year 1 and Year 4; Non-maintain: ≥10% weight loss at Year 1 and <10% weight loss at Year 4. Overall p-value represents whether the distribution of participants falling into the various PA categories differs between weight loss Maintainers and Non-maintainers. * indicates that the percentage of Maintain participants falling within a particular MVPA category is significantly different from the percentage of Non-maintain participants falling into that category. a. Aim 3: Percentage of participants maintaining or not maintaining weight loss from years 1-4, stratified by MVPA levels at year 1, b. Aim 3: Percentage of participants maintaining or not maintaining weight loss from years 1-4, stratified by MVPA levels at year 4

