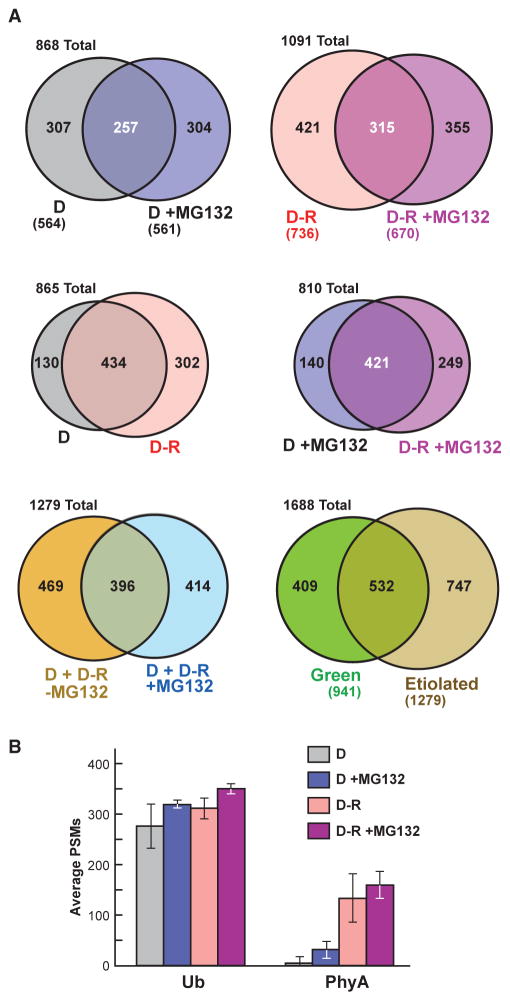
Figure 2. Comparisons of the Ubiquitylated Protein MS Datasets Obtained from Etiolated Arabidopsis Seedlings Before (D) and After Red-Light Irradiation (R) and/or MG132 Exposure.
(A) Venn diagrams showing overlap of the ubiquitylated protein data-sets. The number of proteins in each sector is indicated. The numbers in parentheses indicate the total number of proteins in each dataset. The etiolated dataset represents the combined catalog of proteins detected in dark-grown seedlings with or without exposure to 50 μM MG132 and/or red light. The green MS dataset was obtained from 14-day-old, light-grown seedlings and was described previously (Kim et al., 2013).
(B) Abundance of Ub and PhyA peptides in the MS datasets as quantified by peptide spectral matches (PSMs). Each bar represents the average of three biological replicates (±SD).

