Fig. 3.
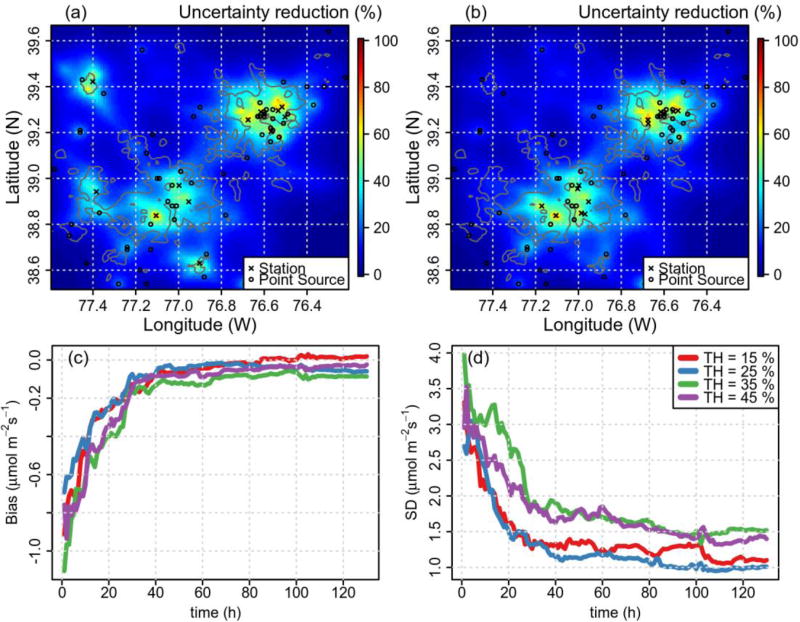
Uncertainty reduction using threshold values of (a) 15% and (b) 45%, and the (c) bias and (d) standard deviation (SD) evolution of the CO2 flux retrieval for the urban land use with four threshold values employed in the selection of the network for the month of February (afternoon hours) by using 12 towers, a correlation length 10 km, and a model–data mismatch of 5 ppm.

