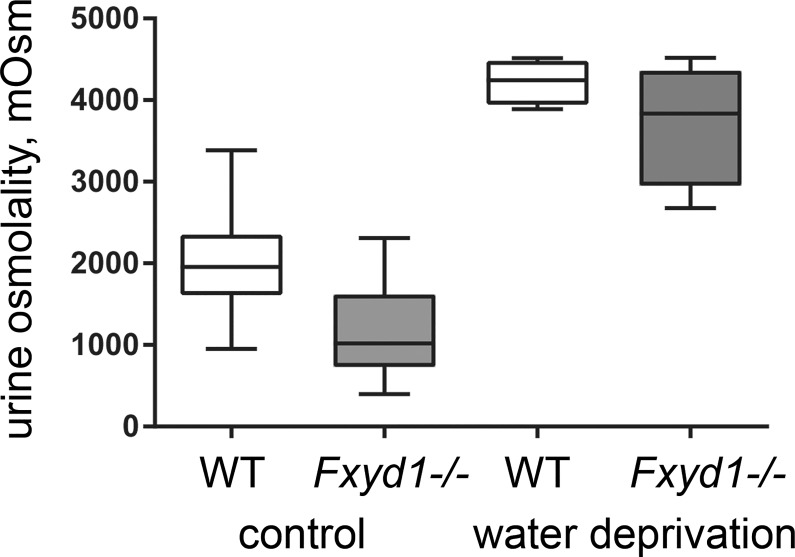
Fig 1. FXYD1 is implicated in urinary concentration.
Box and whisker plot of the osmolality of daytime (afternoon) samples of male mouse WT and knockout (KO) urine at baseline and after water deprivation, showing a difference in baseline osmolality but the near-normal ability of the KO to concentrate its urine. The asterisks indicate a P value of <0.0001, 2-tailed Student’s t-test. When calculated as average ± SEM the results were as follows. WT control conditions, 2,019 ± 143, n = 20; KO control conditions 1,161 ± 123, n = 21; Student’s t-test, P < 0.0001. WT after 36 hours water deprivation, 4,224 ± 140, n = 8; KO water deprivation, 3,716 ± 383, n = 8; t-test, P = 0.26. Female mice were also tested in control conditions, and the results for baseline osmolality were WT, 2,169+/-92, n = 7; KO, 1,085+/-108, n = 7, t-test P < 0.001.

