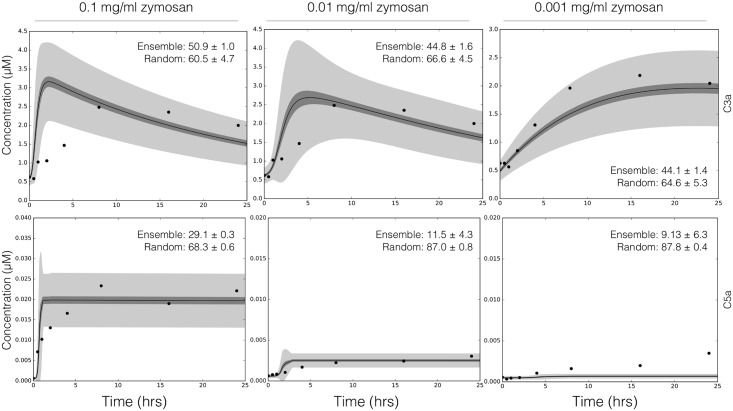
Fig 3. Reduced order complement model predictions.
Simulations of C3a and C5a generated using 0.1 mg/ml, 0.01 mg/ml, and 0.001 mg/ml zymosan were compared with the corresponding experimental measurements. The solid black lines show the simulated mean value of C3a or C5a for the ensemble, while the dark shaded region denotes the 99% confidence interval of mean. The light shaded region denotes the 99% confidence interval of the simulated C3a and C5a concentration. The experimental validation data (points) was taken from Morad et al [35]. All initial conditions not specified by the experimental condition were assumed to be at zero or their physiological serum levels unless otherwise noted (S1 Table).

