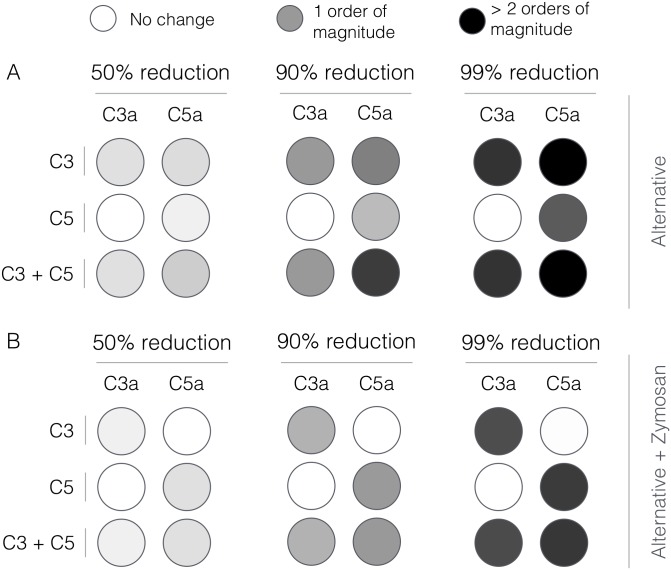
Fig 6. Robustness analysis of the complement model.
Robustness coefficients were calculated for a 50%, 90% and 99% reduction in C3, C5, or C3 and C5 initial conditions. A: Mean robustness index for C3a and C5a generated in the absence of zymosan. B: Mean robustness index for C3a and C5a generated in the presence of 1 mg/ml zymosan. The color describes the degree of reduction of C3a or C5a following the network perturbation. Robustness coefficients were calculated using all parameter sets with Pareto rank less than five (N = 65). Mean robustness values were reported.

