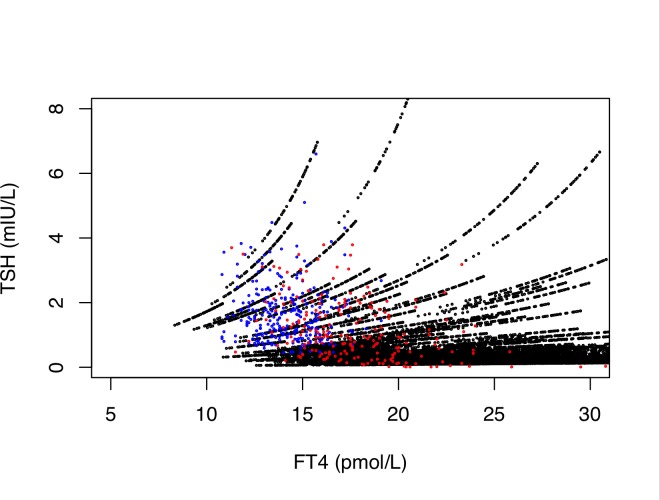
Fig 4. Phi-adjusted cluster of random individual set points (black symbols).
The overlay depicts observed data points from euthyroid controls (n = 268, blue symbols) and LT4-treated patients (n = 207, red symbols). This simulates the possibility of a gradient change in the TSH-FT4 relationship. Reconstruction was done as described in Fig 2, but, unlike in Fig 2, the gradient phi was not fixed, rather continuously increased over the extended GT range (1.67 to 50 nmol/s). It was randomly sampled from a normal distribution (mean 0.3, sd 0.08).

