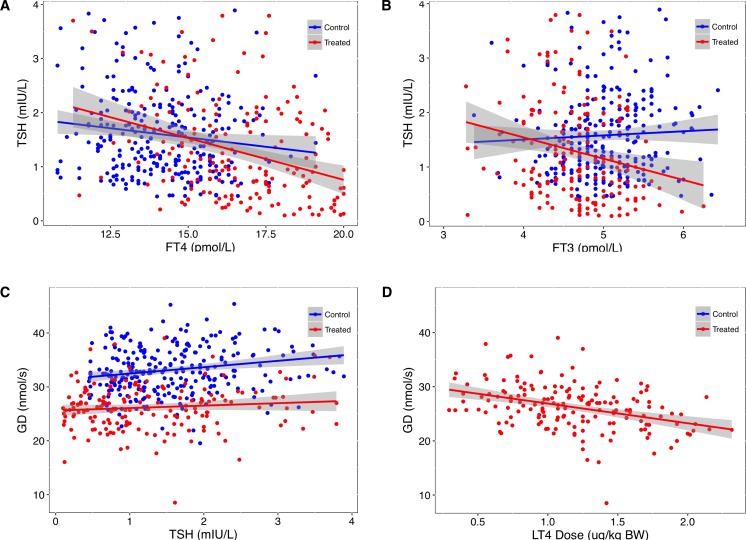
Fig 5.
Relationships between TSH and FT4 (A), FT3 (B) and step-up deiodinase activity (GD, C) in a control group of healthy subjects and a group of LT4-treated patients with benign thyroid disease. The correlation between GD and weight adjusted L-T4 dose is shown in panel D. Regression lines are surrounded by the 95% confidence interval (shaded area). Statistical difference in slopes between groups was for TSH vs FT4 (A) p = 0.055, for TSH vs FT3 (B) p< 0.001, and for GD vs TSH (C) p = 0.14. GD values differed significantly (p<0.001) between controls and treated patients, and r2 for the depicted GD vs LT4 dose correlation (D, p< 0.001) was 0.58. See methods section for patient characteristics.

