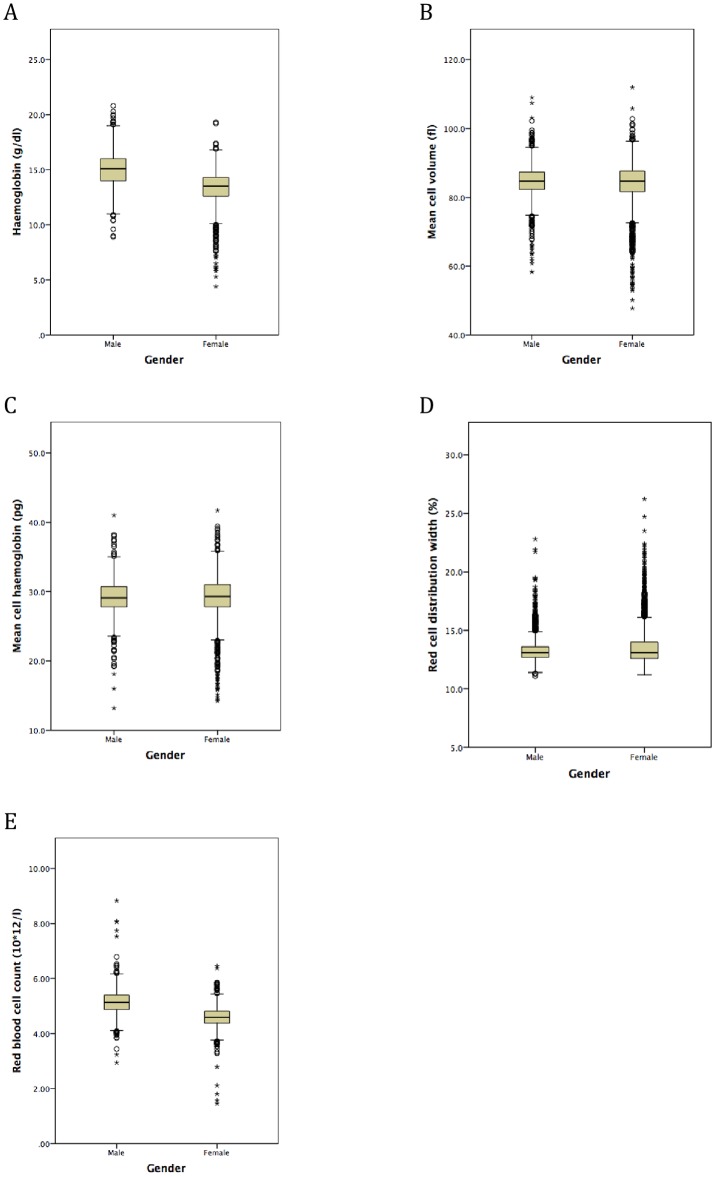
Fig 2. Box plots to show haemoglobin and red cell indices according to gender in secondary school students from Sri Lanka: (A) haemoglobin; (B) mean cell volume; (C) mean cell haemoglobin; (D) red cell distribution width; (E) red blood cell count.
Horizontal lines inside the box show the median value, box length is the interquartile range and whiskers show the range, excluding outliers. Outlying values 1.5 to 3, or > 3 box lengths from the upper and lower edge of the box are shown as open circles and stars respectively.

