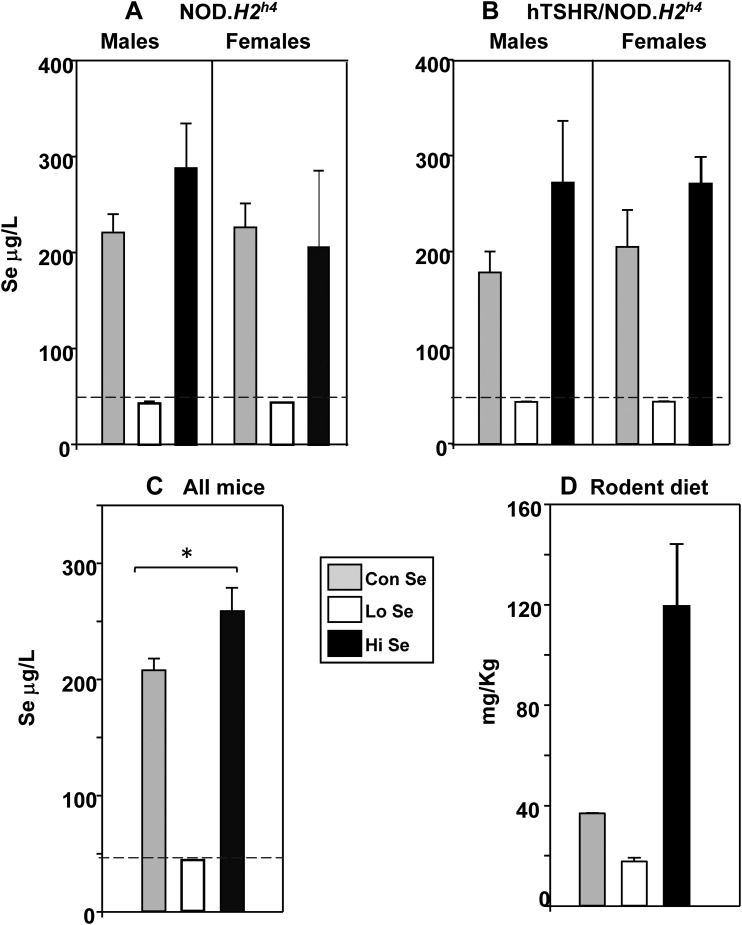
Figure 7.
Se content of mouse sera and custom diets. (A–C) Se was analyzed (by inductively coupled plasma mass spectrometry) in sera from mice exposed for 4 months to custom Se diets containing Lo, Con, or Hi levels (together with iodide supplemented water). (A) Nontransgenic NOD.H2h4 males and females and (B) transgenic TSHR/NOD.H2h4 males and females; Se data are shown as μg/L [mean + standard deviation (SD) for duplicate aliquots]. (C) Combined Se values for all mice on the three custom diets (mg/L, mean + standard error of the mean, n = 8 measurements). *P = 0.029, Rank sum tests. (D) Se content of custom diets (ng/g diet sample, mean + SD of duplicates). The dashed lines in (A–C) represent the mean + 2 SDs of Se values in all mice on Lo Se.

