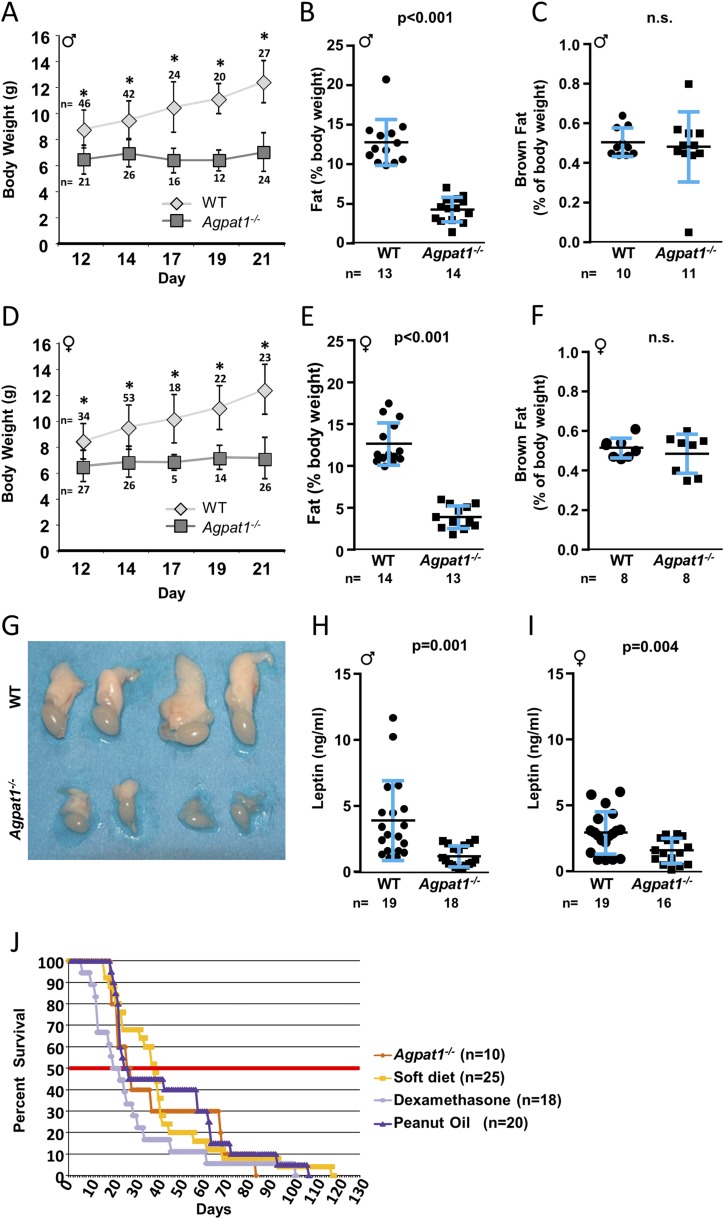
Figure 2.
Agpat1−/− mice had reduced body weight, total body fat, and plasma leptin level. The body weight of Agpat1−/− mice did not increase as the mice aged compared with WT mice [(A) male; (D) female] (numbers of animals are shown above or below the symbols). For statistical analysis, see the Materials and Methods section. The nuclear magnetic resonance spectroscopy measurement shows that Agpat1−/− mice had decreased total body fat [(B) male; (E) female]. There was no significant difference (n.s.) in the brown fat pad between 21-day-old WT and Agpat1−/− (C) male and (F) female mice. (G) We observed reduced epididymal fat pads in all Agpat1−/− male mice. Shown are fat pads attached to testes from 21-day-old WT and Agpat1−/− mice (two each). Reduced leptin levels were observed in 21-day-old (H) male and (I) female mice. (J) Rescue from neonatal death was attempted in Agpat1−/− mice by administration of peanut oil, a soft diet, or dexamethasone (dex). Mixed-sex groups of Agpat1−/− mice were injected intraperitoneally daily with dex (1 μg/g) or peanut oil (100 μL) until the mice succumbed. The soft diet was placed in a petri dish on the cage floor. In the treatment schedule, there was a decrease in the survivability at 50% survival only for the dex-treated group (P = 0.0539). However, the overall survival of treated Agpat1−/− mice was not much different from that of untreated mice. The number of mice tested is shown for each treatment group. Percent survivability was calculated against the total number of mice at the start of the treatment. Such treatment started around day 14, when the genotypes were available. The thick horizontal midline represents 50% survivability. The black line and error bars represent the mean ± standard deviation, with the number of animals used shown beneath graphs (B, C, E, F, H, and I) and beside graph (J). *P < 0.001 by mixed-effects repeated-measures analysis in (A) and (D). Dot plot P value was determined by two-tailed Student t test. Survival curve P value was determined by generalized Wilcoxon test followed by the Dunnett test for comparisons to the control group. ♂, male; ♀, female.

