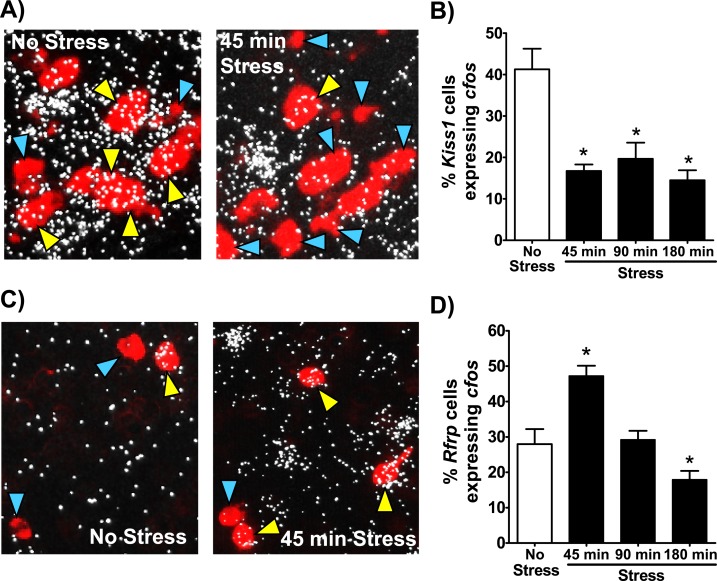
Figure 4.
Kiss1 and Rfrp neuronal activation levels in stress and no-stress female mice. (A) Representative high-magnification images of Kiss1 (red fluorescence) and cfos (silver grains) gene expression in the arcuate nucleus of a no-stress control female (left) or female after 45 minutes of stress (right). Yellow arrowheads denote example Kiss1 cells with cfos induction. Blue arrowheads denote example Kiss1 cells not coexpressing cfos. (B) Quantification of the percent of Kiss1 neurons coexpressing cfos in each group. (C) Representative lower-magnification images of Rfrp (red fluorescence) and cfos (silver grains) expression in the DMN of a no-stress control female (left) or female after 45 minutes of stress (right). Yellow arrowheads denote example Rfrp cells with cfos induction. Blue arrowheads denote example Rfrp cells not coexpressing cfos. (D) Quantification of the percent of Rfrp neurons coexpressing cfos in each group. *P < 0.05 vs no-stress controls.

