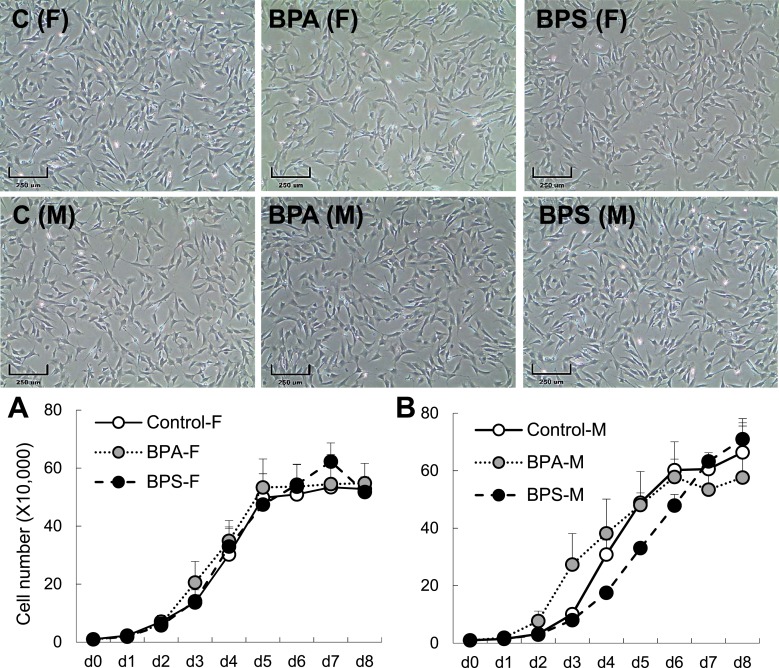
Figure 4.
Effect of gestational BPA and BPS exposure on fetal preadipocyte proliferation. Representative images of preadipocytes at day (d) 0 of culture in control, BPA, and BPS gestationally exposed female (F; top) and male (M; bottom) cultured primary cells (n = 3 per group). Growth curves (mean ± SE) of (A) female and (B) male primary preadipocytes. Scale bar: 250 μm. C, control.

