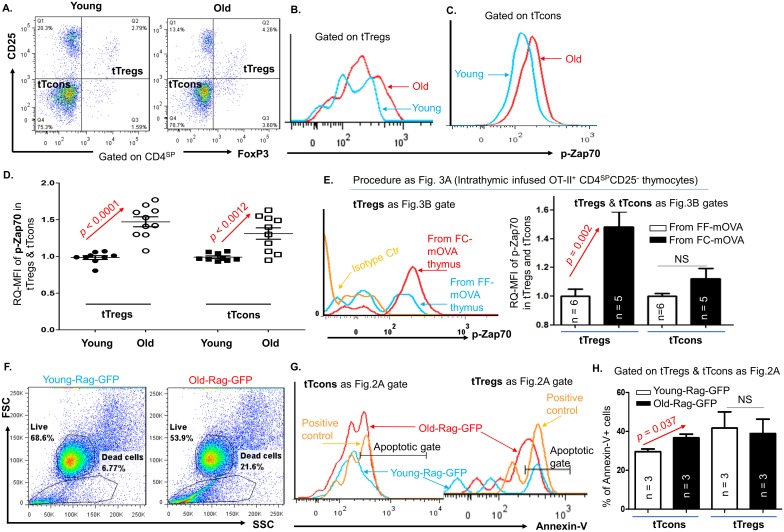
Fig 4. p-Zap70 was increased in both tTreg cells and tTcon cells, but apoptosis was only increased in tTcon cells in the aged and atrophied thymus.
(A) Representative gate strategy shows the percentage of tTreg cells versus tTcon cells from the thymi of WT young and naturally aged mice. (B) A representative histogram shows expression of p-Zap70 in the tTreg cells of WT young (blue curve) and naturally aged (red curve) mice. (C) A representative histogram shows expression of p-Zap70 in the tTcon cells of WT young (blue curve) and naturally aged (red curve) mice. (D) A summary of RQ-MFI of p-Zap70 in the tTreg cells and tTcon cells of WT young and naturally aged mice. (E) The workflow is the same as Fig 3A. Left panel: A representative result shows expression of p-Zap70 in the tTreg cells derived from i.t. infused sorted CD4SPCD25-neg pre-tTreg cell thymocytes of OT-II+/Rag−/− mice in FF-mOVA (blue line) and FC-mOVA (red line) thymi. Right panel: A summary of RQ-MFI of p-Zap70 in the tTreg cells and tTcon cells from left penal mice. (F) Representative dot plots from young and old-Rag-GFP reporter mice show increased dead/necrotic cells in the old mice. (G) Histogram shows Annexin-V+ apoptotic cells in tTcon cells and tTreg cells (gates as in Fig 2A right panel). (H) A summarized result of percentages of Annexin-V+ apoptotic tTcon cells and tTreg cells in young and old-Rag-GFP mice, respectively. In panels D, E, and H, Student t test was used to determine statistical significance between groups; data are expressed as mean ± SEM; and each symbol represents an individual animal sample or n = animal numbers. Underlying data used in the generation of this figure (panels D, E, and H) can be found in S1 Data. CD, cluster of differentiation; FF, FoxN1fx/fx without CreERT for controls; i.t., intrathymically; mOVA-Tg, membrane-bound ovalbumin transgenic mouse model; OT-II+ TCR Tg, MHC class-II restricted ovalbumin-specific TCR transgenic; mOVA, membrane-bound ovalbumin; p-Zap70, phosphorylated-zeta-chain-associated protein kinase 70; RQ-MFI, relative quantitative Mean Fluorescence Intensity; tTcon, thymic conventional T cell; tTreg, thymic regulatory T cell; WT, wild-type.

