
Figure 2.
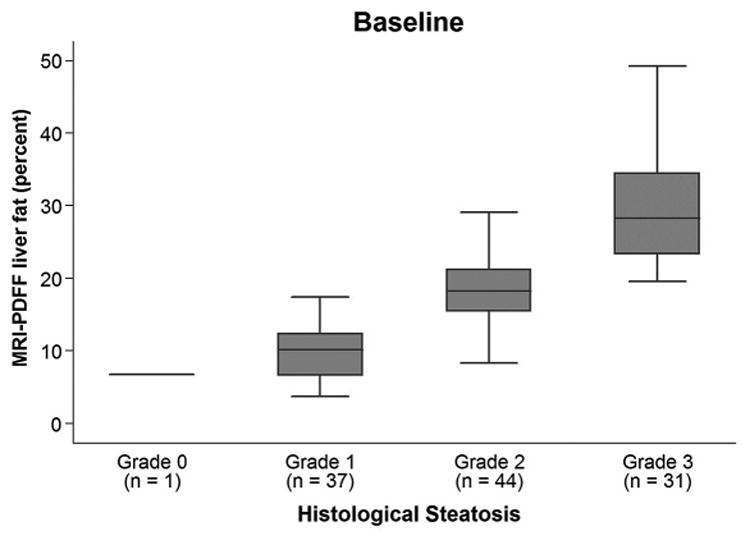
Bar and whisker plot at baseline of PDFF vs steatosis grade. For each steatosis grade, maximum and minimum PDFF values are indicated by horizontal lines at the bottom and top of each steatosis grade entry, the darkened box in the middle represents PDFF data points in the 25% to 75% interquartile range, and the line through the middle of the central darkened box represents the median PDFF value.