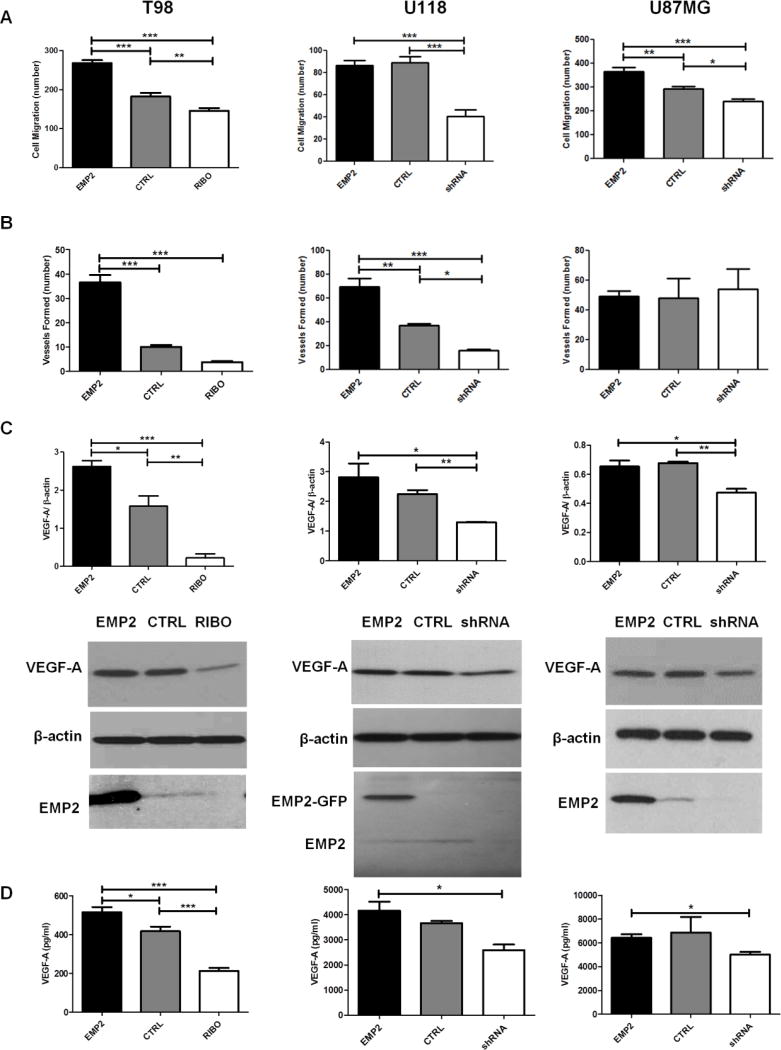
FIG 2. EMP2 Potentiates HUVEC Migration and Tube Formation and Increases VEGF-A Expression and Secretion in vitro.
T98, U118 or U87MG cells with different levels of EMP2 were cultured for 48 hours and conditioned media were collected at the end of incubation. (A) HUVEC migration assay and (B) capillary tube formation were performed as described in methods. Migratory cell numbers were averaged by counting four random fields per transwell under 400× magnification using a bright field microscope with the averaged results presented. Tube formation was evaluated under a fluorescent microscope and all fully formed tubes were counted on the entire cover slips. The experiment was repeated three times, and the averaged results presented. (C) T98, U118 or U87MG cells with different levels of EMP2 were cultured for 48 hours and cells were lysed to evaluate VEGF-A expression by Western Blots. Quantification of VEGF-A expression normalized by β-actin were determined by NIH Image J software (top) and representative images of Western Blots show the expression of VEGF-A, EMP2, or β-actin (bottom). (D) T98, U118 or U87MG with different levels of EMP2 were cultured for 48 hours and conditioned media were collected at the end of incubation. Secreted VEGF-A levels in conditioned media were examined by VEGF-A ELISA. The experiments were performed in triplicate or duplicate and repeated at least three times. One-way analysis of variance with a Bonferroni post-test was calculated to determine the difference among three groups. Significance was not reached in U87MG panel by one-way analysis of variance, a student’s t test was performed between U87MG/EMP2 and U87/shRNA. Significance was defined as *p<0.05, ** p<0.001, *** p<0.0001.

