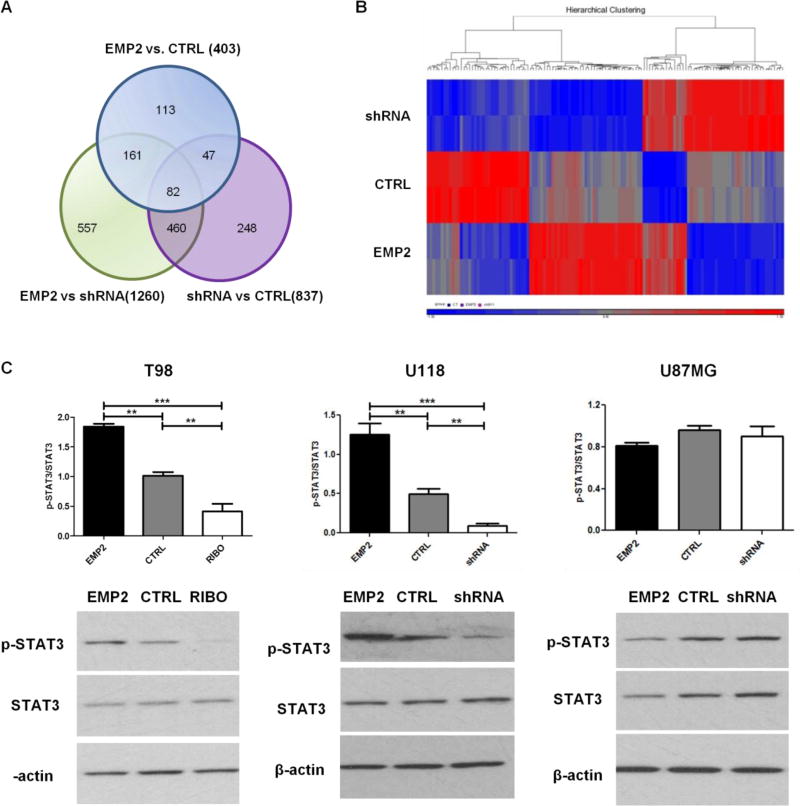
FIG 3. U118 Affymetrix RNA Microarray and EMP2 Regulates STAT3 in Some GBM Cells.
RNA was extracted from U118/EMP2, U118/CTRL or U118/shRNA. Affymetrix U133 plus 2.0 microarrays were performed in duplicate and the average of two samples was taken. The relative abundance of specific gene expression was determined among groups. (A) Gene expression was detailed between groups in a Venn diagram. (B) 129 genes were expressed more than 1.5 fold between groups and heat map analysis displayed the differential gene profiling hierarchy among three groups using R software. (C) T98, U118 or U87MG cells with different levels of EMP2 were cultured for 48 hours and cells were lysed to evaluate total STAT3 expression as well as STAT3 phosphorylation at Y705 by Western Blots. Quantification of STAT3 phosphorylation normalized by total STAT3 expression were determined by NIH Image J software (top) and representative images of Western Blots showed the expression of p-STAT3, STAT3 or β-actin (bottom). The experiments were repeated at least three times. One-way analysis of variance with a Bonferroni post-test was calculated to determine the difference among three groups. Significance was defined as ** p<0.001, *** p<0.0001.

