Figure 2. Transcriptionally active svb loci reside in regions of high Ubx concentration.
(A) Embryos co-stained for both Ubx protein (magenta) and shavenbaby (svb) intronic mRNA (green). Bright spots of svb intronic nascent mRNA mark actively transcribed svb loci. Regions with high levels of both svb transcription and Ubx appear white (the sum of the two colors). (B) Higher magnification, Airyscan image of the region noted in panel (A), revealing sites of svb transcription (green). (C, D) Higher magnification, Airyscan images of the nuclei noted in panel (B). (E, F) 3D surface plots of the images in panels (C) and (D), centered on the sites of svb transcription (green), where height represents Ubx intensity. (G) A representative nucleus used for quantifying Ubx distribution around a svb transcription site. (H) 3D view of the confocal stack from the nuclei in panel (G). (I) Schematic outlining the method of Ubx quantification surrounding svb transcriptional sites. A 3D radial distribution of the average Ubx intensity on the surface of a sphere centered at the site of svb transcription was calculated. The gray sphere and white outlines is an example of the sphere with a radius r = 1 μm. (J) Quantification of the average relative concentration of Ubx and the distance from svb transcription sites (n = 59, see method supplements ‘settings for extracting radially averaged distributions’ for how relative concentration is computed). The shaded region indicates the variance. A.U. indicates Arbitrary Units of fluorescence intensity.

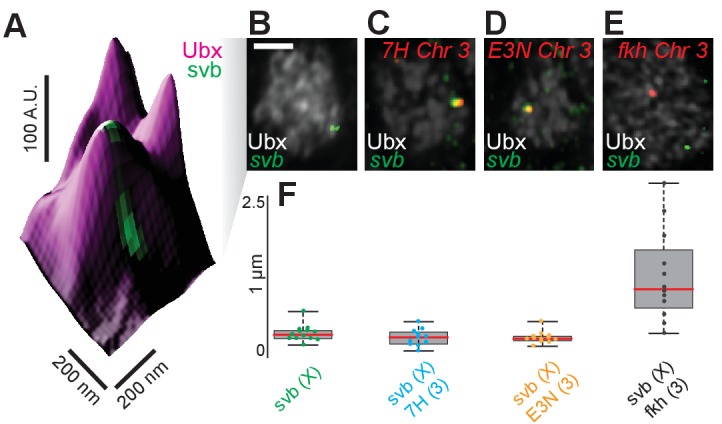
Figure 2—figure supplement 1. Transcription sites of minimal svb enhancers and the endogenous svb locus localize close to each other.