Figure 3.

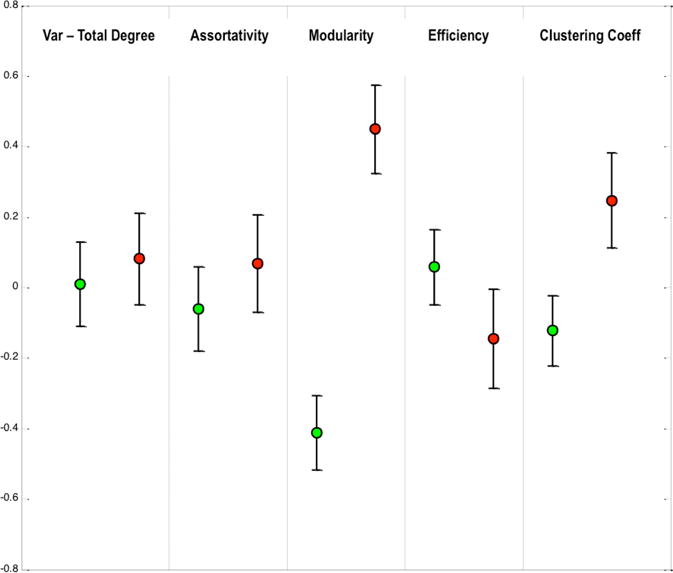
The distribution of global graph measures for the two subject groups (Red: Diseased, Green: Healthy). Error bars represent the standard error of mean. Trending differences are seen for Modularity and Clustering Coefficient (p<0.1).

The distribution of global graph measures for the two subject groups (Red: Diseased, Green: Healthy). Error bars represent the standard error of mean. Trending differences are seen for Modularity and Clustering Coefficient (p<0.1).