Abstract
Second harmonic generation (SHG) imaging is a well-suited multiphoton technique allowing visualization of biological tissues mainly composed of collagen with submicron resolution. Despite its inherent confocal properties, imaging of deeper layers within thick samples has still some limitations. Although the use of longer wavelengths might help to overcome this, the dependence between SHG signals and wavelength is still under discussion. We report here on the dependence with wavelength of SHG signals from collagen-based ocular tissues. The quality of SHG images for two commonly used excitation wavelengths (800 and 1045 nm) is studied. The analysis of the collagen structural information reveals that the information provided by both wavelengths is similar. It was also found that, independently of the depth location, 1045-nm SHG images presented always lower signal levels than those acquired with 800 nm. However, the contrast of the former images was higher, what may improve the visualization of certain features of interest.
OCIS codes: (170.3880) Medical and biological imaging, (180.4315) Nonlinear microscopy, (170.4470) Ophthalmology, (170.6935) Tissue characterization
1. Introduction
Second harmonic generation (SHG) [1,2] is a multiphoton tool suitable for imaging collagen-based ocular structures such as the sclera [3–6] and the cornea [7–11]. Although ocular components are connective tissues mainly composed of type-I fibrillar collagen, the sclera is opaque and the cornea highly transparent, probably due to a different arrangement of the collagen matrix. The natural non-centro-symmetric molecular organization of the collagen generates efficient SHG signal enabling three-dimensional microscopic analysis without exogenous labels [2,12].
As SHG is a coherent process, some phase matching occurs in the focal volume among the scatter elements. Although SHG signal is prevalently emitted in the forward direction, backward phase matching also occurs under exceptional circumstances. Differences between forward and backward SHG signals have been previously analyzed in depth [13]. In terms of corneal imaging, Han et al. reported that whereas backward SHG signal of the stroma provides collagen bundle information, forward SHG visualization provides more details on submicron fibril structure [3]. However, in practical, backward SHG is the only modality for clinical examination and in vivo observation of collagen based ocular structures [14,15].
To our knowledge, Fine and Hansen were the first to report SHG conversion in both corneal and scleral tissues [16]. However, it wasn’t until 2002 when Yeh and associates acquired SHG microscopy images in an ex-vivo rabbit cornea [7]. Since then, the organization and structure of the healthy corneal stroma has been investigated in non-stained (fixed or ex-vivo) corneal tissues of different species, including humans [4,5,7–12]. SHG techniques have also been used to analyze pathological corneas suffering from keratoconus [17,18], edema [19] or bullous keratopathy [20] among others. The spatial changes in the distribution of collagen fibers in control and diseased corneas has been also reported [21–23].
Sample’s aberrations and scatter decrease SHG effectiveness at deeper layers [24], even in transparent media. Consequently, the deeper the location within the sample to be imaged, the lower the quality of the acquired image. This is a limitation in SHG imaging of ocular tissues, where some pathologies or non-controlled structural changes might be placed at deeper locations [17–21]. Adaptive optics has been used to improve SHG imaging of corneal tissues at the posterior stroma [24–26].
For a better visualization of special features in SHG images, especially at deeper locations, an alternative approach could be the use of longer wavelengths that penetrate better into the tissue [27]. However, the wavelength dependence of SHG signal from collagen-based tissues is still under discussion [28–30].
To better understand this problem, we have compared the image quality of SHG images when using two different infrared wavelengths. The pros and cons of using longer wavelengths for this type of collagen tissues are discussed.
2. Methods
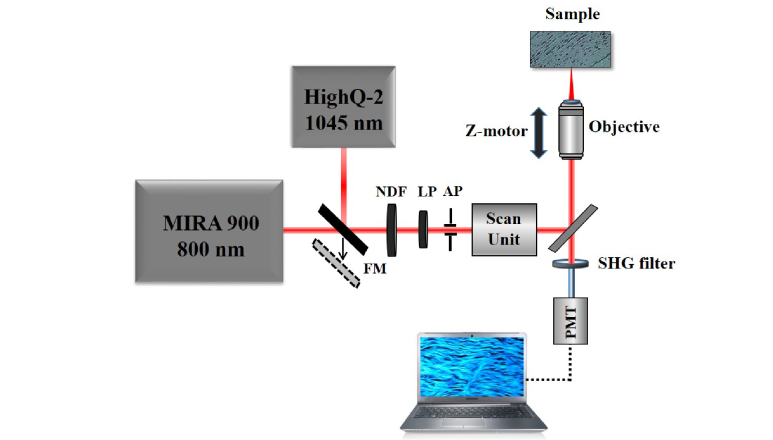
SHG imaging was performed using a custom-built scanning multiphoton microscope previously described [10]. The instrument has been modified to include a dual femtosecond (fs) laser illumination (Fig. 1). This consisted of a fs-laser emitting at 800 nm (Mira 900, Coherent, 76 MHz repetition rate) and another emitting at 1045 nm (HighQ-2, Spectra Physics, 63 MHz repetition rate). Both lasers provided similar pulse length as measured in situ with an autocorrelator (200 and 180 fs respectively). A flip mirror (FM) allowed to select the desired beam and an aperture (AP) limited both beams to the same size. Both lasers were linearly polarized, that minimized any possible dependence between the SHG signal of collagen-based samples and the incident polarization [31–33]. For every analyzed specimen, the laser intensity at the sample’s plane was set to be the same for both wavelengths (this was controlled with a variable neutral density filter, NDF). A pair of non-resonant galvanometric mirrors was used as XY optical scanning unit. A non-immersion long working distance microscope objective (20x, NA = 0.5) was used to focus the beam onto the sample. A DC-motor controlled the location of the imaged plane within the sample along the Z direction. The generated nonlinear signal was collected in the backscattered direction through the same objective. A spectral filter placed in front of the detection unit (PMT) isolated the SHG signal from the collagen structures. Since the focal position depended on the wavelength, the “zero-distance” for depth imaging was established as the first imaged plane where SHG signal appeared. When imaging the corneal stroma, all SHG images corresponded to the central part of the cornea (i.e. the apex). As an image quality metric the Michelson contrast was used [34]. This has been reported to be useful in the analysis of different ophthalmoscopic images [35,36].
Fig. 1.
Schematic diagram of the SHG imaging microscope. FM, flip mirror; LP, linear polarizer; NDF, variable neutral density filter; AP, aperture; PMT, photomultiplier.
The objective analysis of the collagen distribution has been carried out by means of the structure tensor method [23]. In brief, this consists of a representative matrix which elements are the partial derivatives computed along the main X-Y directions. It contains information about the orientation and isotropy of every image pixel, which is appropriate to investigate spatially resolved SHG images from collagen distributions. The numerical parameters provided by this tool are the degree of isotropy (DoI, ranging between 0 and 1) map and the histogram of preferential orientation (PO, between −90° and 90°). The standard deviation of the PO is defined as the structural dispersion (SD) of the collagen fibers. In easy words, the higher the DoI (larger organization), the lower the SD. Details on this can be found in [23].
Human, eagle and porcine non-stained corneas were used in this study. A piece of non-stained bovine sclera was also used. Eagle cornea, porcine cornea and bovine sclera were fixed in paraformaldehyde. Human corneas (not suitable for transplantation) were stored in Optisol solution. This study was approved by the ethical committee of the Universidad de Murcia.
3. Results
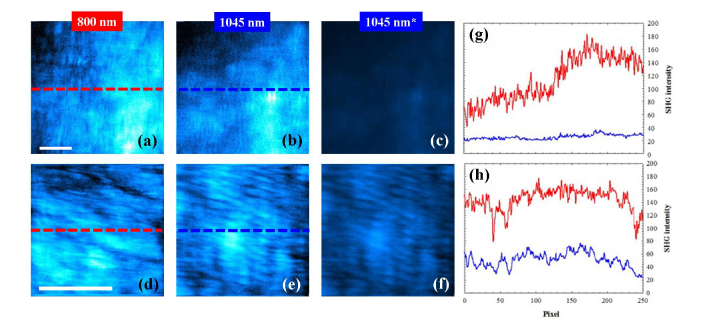
Figure 2 presents SHG images of a human cornea and a bovine sclera acquired with the two wavelengths. Each SHG image presented along this work corresponds to an individual frame. For both samples the imaged planes were randomly chosen. Left and central panels have been auto-scaled (i.e. normalized at their maximum values). For better comparisons 1045-nm images are also shown with the same color scale as those of 800-nm (see SHG images on the right). A direct visualization of the auto-scaled images reveals that the arrangement of the collagen fibers can be seen with both wavelengths. It seems obvious that pairs of images are not identical. The main reason for this might be the difference in the depth location of the imaged planes. It is hard to experimentally get exactly the same focal position for two laser sources with different wavelength. However, the quantitative (and objective) analysis of those images indicates that they provide similar information. In particular, the intensity profiles along the inserted horizontal lines are depicted in the corresponding plots. Although the average SHG signals for 800 nm were respectively 2 and 2.5-fold higher than those corresponding to 1045 nm, the normalized profiles did not shown statistical differences (t-test, p = 0.867 for Fig. 2(g) and p = 0.779 for Fig. 2(h)).
Fig. 2.
Auto-scaled SHG images of a human cornea (140-μm depth, upper panels and a bovine sclera (175-μm depth, bottom panels) for 800 nm (a, d) and 1045 nm (b, e). (c, f) 1045-nm SHG images with the same color scale as (a, d). The imaged plane was randomly chosen. Scale bar: 50 μm. (g, h) SHG intensity profiles along the dashed lines indicated in Fig. 2(a) and 2(b) bovine sclera. Red line, 800 nm; blue line, 1045 nm.
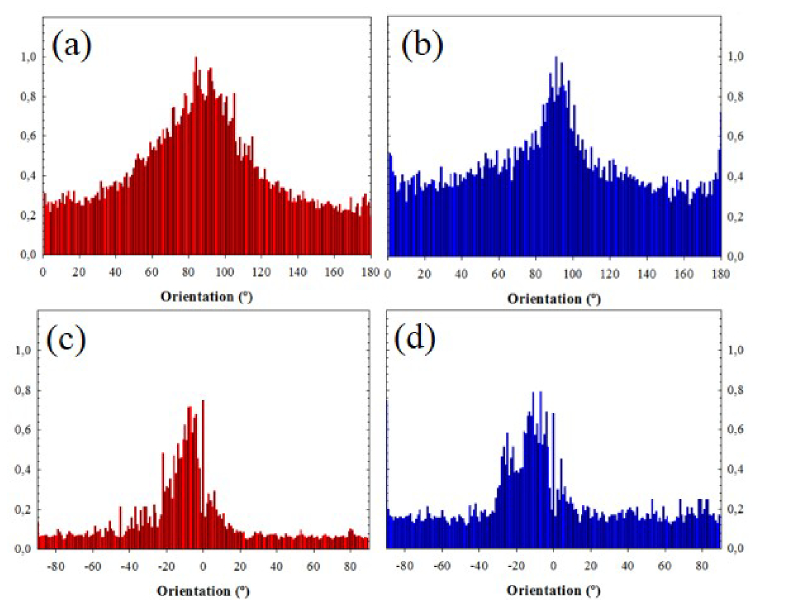
To verify if the collagen distribution provided by both wavelengths differs, the structure tensor was used [23]. Figure 3 compares the histograms of PO for both samples and wavelengths. The average PO values for the cornea images were 85° (SD = 21°) and 87° (SD = 18°) for 800 and 1045 nm respectively. For the sclera sample, the SHG image presented a PO at −8° (SD = 9°) for 800 nm and −11° (SD = 10°) for 1045 nm. The Kolmogorov-Smirnov test shows no statistical differences (p = 0.463 for the cornea and p = 0.847 for the sclera).
Fig. 3.
Histograms of PO corresponding to SHG images recorded with 800 (a, c) and 1045 nm (b, d). The samples were the same as in Fig. 2: human cornea (upper plots) and bovine sclera (bottom plots).
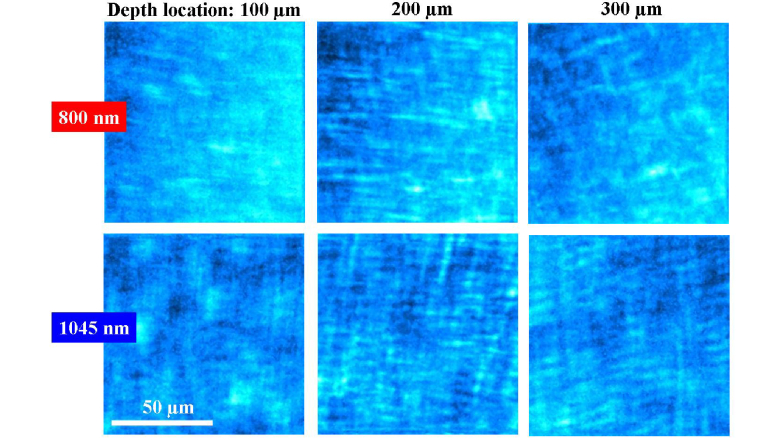
Two series of SHG images of an eagle cornea at different depths are presented in Fig. 4. The stromal organization is revealed at every depth position for the two wavelengths. The collagen lamellae are mostly lying parallel to the corneal surface. Sequential images corresponding to deeper locations show collagen bundles running parallel to each other with some orthogonal interweaving. Moreover, this pattern presents an angular shift for every Z-position.
Fig. 4.
SHG images of the corneal stroma of an eagle eye at different depth locations recorded with 800 (upper panels) and 1045 nm (bottom panels).
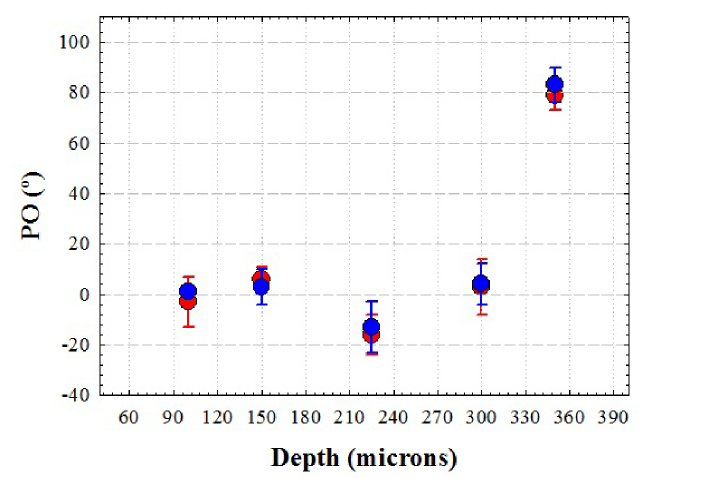
Similar to Fig. 2, although pairs of SHG images are not identical, the information on the collagen structure provided by both wavelengths is similar. This can be seen in Fig. 5. This compares the PO for the two wavelengths and different depth locations.
Fig. 5.
PO of the collagen fibers computed with the structure tensor as a function of depth for 800 (red symbols) and 1045 nm (blue symbols) in an eagle cornea. Errors bars indicate the SD.
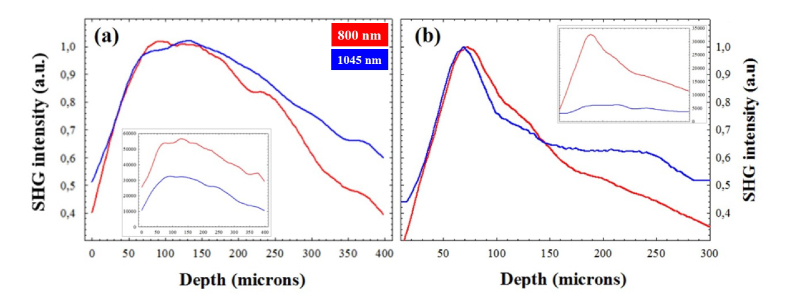
For a more in-detail analysis of the SHG signal for both wavelengths, Fig. 6 compares the SHG intensity profiles as a function of depth in two samples for the two wavelengths used. Data correspond to stacks of SHG images spaced 25 μm in depth. The total SHG intensity for 800 nm was noticeable higher than that corresponding to 1045 nm (50.2% and 82.6% for the eagle and the human cornea respectively). This behaviour was similar for the rest of samples and differences ranged between 65 and 88%. When normalizing the data, both wavelengths provided similar SHG signal for shallow corneal layers, until ~150 μm. However, at deeper layers into the sample the 1045-nm SHG curves were always above those obtained for 800 nm.
Fig. 6.
Normalized SHG intensity profiles as a function of depth for 800 (red) and 1045 (blue) nm. SHG images were spaced 25 μm in depth. Data correspond to an eagle (a) and a human cornea (b). The insets correspond to the (non-normalized) raw data.
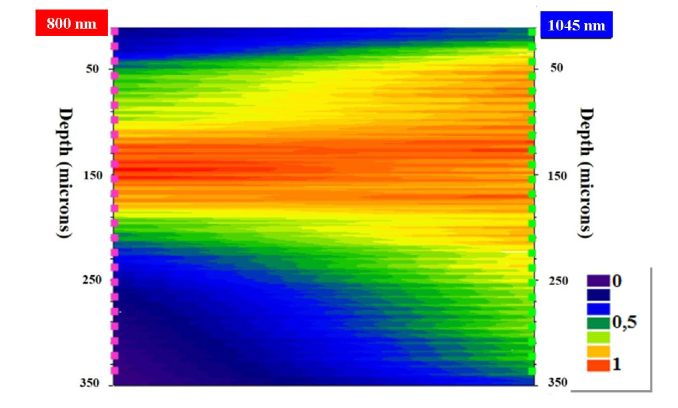
This well-known depth-penetration capacity of longer wavelengths is further represented in Fig. 7. This map directly compares the performance of the SHG intensity in a cornea for the two wavelengths as a function of depth.
Fig. 7.
Map of direct comparison of SHG normalized intensity values for two wavelengths as a function of the sample’s depth.
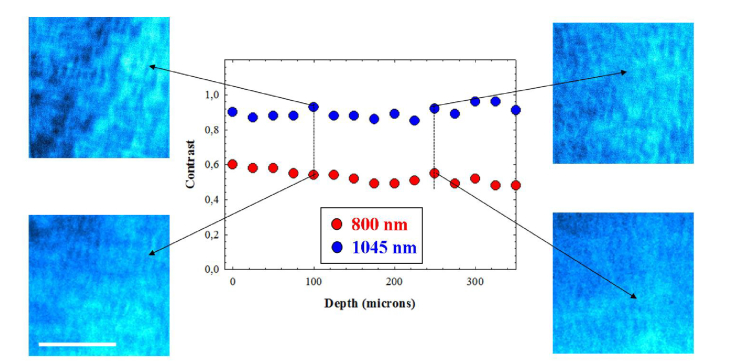
Figure 8 presents the benefit of using longer wavelengths when imaging deeper layers. The values of Michelson contrast for both wavelengths as a function of depth are depicted for one of the samples. Independently on the imaged corneal layer, the SHG images acquired with 1045-nm presented a higher contrast than those of 800-nm. This increase in contrast remained constant within depth. The increase in contrast depended on the samples, between 33% and 80%.
Fig. 8.
Values of Michelson contrast of SHG images of a porcine cornea at different depth locations for 800 (red dots) and 1045 nm (blue dots). Images correspond to the designated locations. Bar length: 50 μm.
For the sense of completeness Table 1 compares the values of Michelson contrast averaged across three axial segments of 100 µm corresponding to the anterior, middle and posterior stroma (300 µm total depth) of two different corneas (eagle and porcine, from Fig. 4 and 8 respectively) for 800 and 1045 nm. Significant differences between both wavelengths were found (t-test, significance level p = 0.05).
Table 1. Mean values of Michelson contrast of SHG images of two corneas as a function of depth (anterior, medium and posterior stroma) for the two different wavelengths.
| Eagle cornea |
Porcine cornea |
||||
|---|---|---|---|---|---|
| Corneal depth location | 800 nm | 1045 nm | 800 nm | 1045 nm | |
| Anterior | 0.32 ± 0.15 | 0.47 ± 0.13 | 0.57 ± 0.02 | 0.89 ± 0.03 | |
| Medium | 0.28 ± 0.02 | 0.44 ± 0.06 | 0.51 ± 0.03 | 0.88 ± 0.03 | |
| Posterior | 0.35 ± 0.05 | 0.44 ± 0.02 | 0.51 ± 0.02 | 0.90 ± 0.04 | |
4. Discussion and conclusions
Longer wavelengths are known to penetrate better into the tissues as they suffer less scattering effects. Results here reported show that there was a noticeable difference in SHG signal when comparing pairs of SHG microscopy images of collagen-based ocular tissues acquired using 800 and 1045 nm. To our knowledge, this is the first time that SHG signals have been compared in these tissues as a function of depth for these wavelengths.
Although the experimental conditions for image acquisition were similar, 800-nm SHG images presented much higher intensity levels that those recorded with 1045 nm. Moreover, normalized SHG signal profiles show that at deeper locations, better SHG signal was obtained when imaging with 1045 nm. This implies an extended imaging depth within the sample. This agrees with the fact that longer wavelengths facilitate the penetration depth within tissues [27].
A non-immersion objective was used for the present experiment. This objective is appropriate for living applications since it avoids corneal contact and the comfort of the subjects is improved [15]. However, commercially available clinical devices use (oil or water) immersion objectives (see [37] as a general reference). These have been demonstrated to provide high numerical apertures and good depth resolution. Moreover, acquired clinical images are very useful for the accurate diagnosis of a number of ocular pathologies. Since the optical resolution depends on the numerical aperture of the objective, the use of this kind of objectives in the experiment here reported would undoubtedly lead to better SHG images.
It is also worth noticing that the quality of SHG images here presented is lower than that reported by these authors in previous publications [10,25,38]. Two reasons might be the responsible for this. On one hand, the ocular tissues used in this work were not fresh and some deterioration might take place (what might affect SHG signal). On the other hand, the SHG images shown correspond to a unique frame. Most papers present figures where each final SHG image was the result of the average of several individual frames. Our images might be improved by averaging more frames and using fresh ocular tissues as samples.
There is still some controversy on the wavelength response of SHG signal from collagen structures. Moreover, since the wavelength dependence of the SHG conversion efficiency have not yet been fully and rigorously explored, this has been a topic of interest. Zoumi and associates analyzed the SHG spectral dependence of type-I rat tail collagen model in reflection mode [39]. They found a maximum for 800 nm and a decrease at longer and shorter wavelengths. Zipfel et al. measured the spectral profile of collagen SHG in the range 740-920 nm, reporting that the SHG efficiency is noticeable higher in the 700- to 800-nm region [28]. Measurements in collagen type-I from bovine Achilles tendon showed four maxima of comparable backscattering SHG intensities at 845, 880, 895, and 915 nm [29]. This wavelength dependence was like that of the rat tendon. However, Shen and colleagues observed that SHG intensity decreased monotonically for excitation from 750 to 950 nm in mouse tendon tissue [40]. In human ovarian tissue and murine tendon, it was observed a strong decrease (by over ~10-fold) in relative SHG intensity at increasing wavelengths over the range of 780-1230 nm [41]. The impact was larger for backward collected SHG. This behaviour confirmed the accuracy of the theoretical model based on the wavelength dependence of the SHG conversion efficiency.
Our results agreed with those ones. For all samples and independently of the depth location, the SHG for 800 nm was significantly higher than that obtained for 1045 nm. This corroborates that the efficiency of SHG conversion is higher for the former wavelength. This is probably the reason because 800 nm is the most often used wavelength in SHG microscopy.
Despite the increasing use of SHG imaging and its inherent confocal properties, the imaging of deeper layers in thick specimens has always been an issue. To our knowledge, results comparing SHG imaging with different illumination wavelengths and different depth locations are scarce in the literature. In type I rat-tail collagen the SHG signal was shown to progressively degrade with increasing depth and fewer collagen fibers were resolved at deeper locations [39]. However, data as a function of depth (up to 230 μm) were only provided for a wavelength of 800 nm. The authors reported that the maximum imaging depth was only limited by the working distance of the microscope objective and the value of excitation power used. For a fixed illumination wavelength, the decrease in SHG signal with depth in corneal tissue is known [25]. However, this behaviour differs between healthy and pathological or surgically-treated corneas [17,18,38,42,43].
More recently Hall et al. analyzed SHG signal in mouse tail tendon and human ovary tissue (80-100 μm thick) as a function of depth for different wavelengths [41]. The intensity profile was found to decrease with depth but this was more pronounced for wavelengths of around 800 nm. They finally concluded that the gain in measured signal strength at longer wavelengths due to reduced scattering is overcome by the decrease in SHG conversion efficiency at longer wavelengths. Our results strongly agree with these ones.
In conclusion, the dependence of SHG images of ocular tissues when imaged with 800 and 1045 nm was investigated. Although a longer wavelength allows deeper penetration within the imaged tissue and superior SHG imaging is expected, the SHG excitation was shown to be less efficient. The reason is that the reduced scattering is a smaller effect than the decreased SHG conversion efficiency. Despite this reduced SHG imaged performance, the visibility of features was often better with longer wavelengths. Since an optimized visualization of corneal details is critical in the detection of pathologies in early stages, the use of longer wavelengths might also be useful in future clinical devices.
Conflicts of interest
The authors declare that there are no conflicts of interest related to this article.
Acknowledgments
This research has been supported by the Secretaría de Estado e Investigación, Desarrollo e Innovación (SEIDI) FIS2016-76163-R, the European Research Council Advanced Grant ERC-2013-AdG-339228 (SEECAT), Fundación Séneca-Agencia de Ciencia y Tecnología de la Región de Murcia (grant 19897/GERM/15) and the European Regional Development Fund (EU-FEDER).
References and links
- 1.Guo Y., Ho P. P., Savage H., Harris D., Sacks P., Schantz S., Liu F., Zhadin N., Alfano R. R., “Second-harmonic tomography of tissues,” Opt. Lett. 22(17), 1323–1325 (1997). [DOI] [PubMed] [Google Scholar]
- 2.Campagnola P. J., Clark H. A., Mohler W. A., Lewis A., Loew L. M., “Second-harmonic imaging microscopy of living cells,” J. Biomed. Opt. 6(3), 277–286 (2001). [DOI] [PubMed] [Google Scholar]
- 3.Han M., Giese G., Bille J., “Second harmonic generation imaging of collagen fibrils in cornea and sclera,” Opt. Express 13(15), 5791–5797 (2005). [DOI] [PubMed] [Google Scholar]
- 4.Teng S. W., Tan H. Y., Peng J. L., Lin H. H., Kim K. H., Lo W., Sun Y., Lin W. C., Lin S. J., Jee S. H., So P. T., Dong C. Y., “Multiphoton autofluorescence and second-harmonic generation imaging of the ex vivo porcine eye,” Invest. Ophthalmol. Vis. Sci. 47(3), 1216–1224 (2006). [DOI] [PubMed] [Google Scholar]
- 5.Wang B. G., Eitner A., Lindenau J., Halbhuber K. J., “High-resolution two-photon excitation microscopy of ocular tissues in porcine eye,” Lasers Surg. Med. 40(4), 247–256 (2008). [DOI] [PubMed] [Google Scholar]
- 6.Yamanari M., Nagase S., Fukuda S., Ishii K., Tanaka R., Yasui T., Oshika T., Miura M., Yasuno Y., “Scleral birefringence as measured by polarization-sensitive optical coherence tomography and ocular biometric parameters of human eyes in vivo,” Biomed. Opt. Express 5(5), 1391–1402 (2014). [DOI] [PMC free article] [PubMed] [Google Scholar]
- 7.Yeh A. T., Nassif N., Zoumi A., Tromberg B. J., “Selective corneal imaging using combined second-harmonic generation and two-photon excited fluorescence,” Opt. Lett. 27(23), 2082–2084 (2002). [DOI] [PubMed] [Google Scholar]
- 8.Morishige N., Petroll W. M., Nishida T., Kenney M. C., Jester J. V., “Noninvasive corneal stromal collagen imaging using two-photon-generated second-harmonic signals,” J. Cataract Refract. Surg. 32(11), 1784–1791 (2006). [DOI] [PMC free article] [PubMed] [Google Scholar]
- 9.Aptel F., Olivier N., Deniset-Besseau A., Legeais J.-M., Plamann K., Schanne-Klein M.-C., Beaurepaire E., “Multimodal Nonlinear Imaging of the Human Cornea,” Invest. Ophthalmol. Vis. Sci. 51(5), 2459–2465 (2010). [DOI] [PubMed] [Google Scholar]
- 10.Bueno J. M., Gualda E. J., Artal P., “Analysis of corneal stroma organization with wavefront optimized nonlinear microscopy,” Cornea 30(6), 692–701 (2011). [DOI] [PubMed] [Google Scholar]
- 11.Park C. Y., Lee J. K., Chuck R. S., “Second Harmonic Generation Imaging Analysis of Collagen Arrangement in Human Cornea,” Invest. Ophthalmol. Vis. Sci. 56(9), 5622–5629 (2015). [DOI] [PMC free article] [PubMed] [Google Scholar]
- 12.Morishige N., Takagi Y., Chikama T., Takahara A., Nishida T., “Three-dimensional analysis of collagen lamellae in the anterior stroma of the human cornea visualized by second harmonic generation imaging microscopy,” Invest. Ophthalmol. Vis. Sci. 52(2), 911–915 (2011). [DOI] [PubMed] [Google Scholar]
- 13.Williams R. M., Zipfel W. R., Webb W. W., “Interpreting second-harmonic generation images of collagen I fibrils,” Biophys. J. 88(2), 1377–1386 (2005). [DOI] [PMC free article] [PubMed] [Google Scholar]
- 14.Latour G., Gusachenko I., Kowalczuk L., Lamarre I., Schanne-Klein M.-C., “In vivo structural imaging of the cornea by polarization-resolved second harmonic microscopy,” Biomed. Opt. Express 3(1), 1–15 (2012). [DOI] [PMC free article] [PubMed] [Google Scholar]
- 15.Ávila F. J., Bueno J. M., Gambín A., Artal P., “Second harmonic generation microscopy of the human cornea and sclera in vivo,” Invest. Ophthalmol. Vis. Sci. 58, 3109 (2017). [Google Scholar]
- 16.Fine S., Hansen W. P., “Optical second harmonic generation in biological systems,” Appl. Opt. 10(10), 2350–2353 (1971). [DOI] [PubMed] [Google Scholar]
- 17.Tan H. Y., Sun Y., Lo W., Lin S. J., Hsiao C. H., Chen Y. F., Huang S. C., Lin W. C., Jee S. H., Yu H. S., Dong C. Y., “Multiphoton fluorescence and second harmonic generation imaging of the structural alterations in keratoconus ex vivo,” Invest. Ophthalmol. Vis. Sci. 47(12), 5251–5259 (2006). [DOI] [PubMed] [Google Scholar]
- 18.Morishige N., Wahlert A. J., Kenney M. C., Brown D. J., Kawamoto K., Chikama T., Nishida T., Jester J. V., “Second-harmonic imaging microscopy of normal human and keratoconus cornea,” Invest. Ophthalmol. Vis. Sci. 48(3), 1087–1094 (2007). [DOI] [PMC free article] [PubMed] [Google Scholar]
- 19.Hsueh C. M., Lo W., Chen W. L., Hovhannisyan V. A., Liu G. Y., Wang S. S., Tan H. Y., Dong C. Y., “Structural characterization of edematous corneas by forward and backward second harmonic generation imaging,” Biophys. J. 97(4), 1198–1205 (2009). [DOI] [PMC free article] [PubMed] [Google Scholar]
- 20.Morishige N., Yamada N., Zhang X., Morita Y., Yamada N., Kimura K., Takahara A., Sonoda K. H., “Abnormalities of stromal structure in the bullous keratopathy cornea identified by second harmonic generation imaging microscopy,” Invest. Ophthalmol. Vis. Sci. 53(8), 4998–5003 (2012). [DOI] [PubMed] [Google Scholar]
- 21.Lo W., Chen W. L., Hsueh C. M., Ghazaryan A. A., Chen S. J., Ma D. H. K., Dong C. Y., Tan H. Y., “Fast Fourier transform-based analysis of second-harmonic generation image in keratoconic cornea,” Invest. Ophthalmol. Vis. Sci. 53(7), 3501–3507 (2012). [DOI] [PubMed] [Google Scholar]
- 22.Bueno J. M., Palacios R., Chessey M. K., Ginis H., “Analysis of spatial lamellar distribution from adaptive-optics second harmonic generation corneal images,” Biomed. Opt. Express 4(7), 1006–1013 (2013). [DOI] [PMC free article] [PubMed] [Google Scholar]
- 23.Ávila F. J., Bueno J. M., “Analysis and quantification of collagen organization with the structure tensor in second harmonic microscopy images of ocular tissues,” Appl. Opt. 54(33), 9848–9854 (2015). [DOI] [PubMed] [Google Scholar]
- 24.Bueno J. M., Gualda E. J., Artal P., “Adaptive optics multiphoton microscopy to study ex vivo ocular tissues,” J. Biomed. Opt. 15(6), 066004 (2010). [DOI] [PubMed] [Google Scholar]
- 25.Bueno J. M., Palacios R., Pennos A., Artal P., “Second-harmonic generation microscopy of photocurable polymer intrastromal implants in ex-vivo corneas,” Biomed. Opt. Express 6(6), 2211–2219 (2015). [DOI] [PMC free article] [PubMed] [Google Scholar]
- 26.Skorsetz M., Artal P., Bueno J. M., “Performance evaluation of a sensorless adaptive optics multiphoton microscope,” J. Microsc. 261(3), 249–258 (2015). [DOI] [PubMed] [Google Scholar]
- 27.Oheim M., Beaurepaire E., Chaigneau E., Mertz J., Charpak S., “Two-photon microscopy in brain tissue: parameters influencing the imaging depth,” J. Neurosci. Methods 111(1), 29–37 (2001). [DOI] [PubMed] [Google Scholar]
- 28.Zipfel W. R., Williams R. M., Webb W. W., “Nonlinear magic: multiphoton microscopy in the biosciences,” Nat. Biotechnol. 21(11), 1369–1377 (2003). [DOI] [PubMed] [Google Scholar]
- 29.Theodossiou T. A., Thrasivoulou C., Ekwobi C., Becker D. L., “Second harmonic generation confocal microscopy of collagen type I from rat tendon cryosections,” Biophys. J. 91(12), 4665–4677 (2006). [DOI] [PMC free article] [PubMed] [Google Scholar]
- 30.Hall G., Tilbury K. B., Campbell K. R., Eliceiri K. W., Campagnola P. J., “Experimental and simulation study of the wavelength dependent second harmonic generation of collagen in scattering tissues,” Opt. Lett. 39(7), 1897–1900 (2014). [DOI] [PMC free article] [PubMed] [Google Scholar]
- 31.Stoller P., Reiser K. M., Celliers P. M., Rubenchik A. M., “Polarization-modulated second harmonic generation in collagen,” Biophys. J. 82(6), 3330–3342 (2002). [DOI] [PMC free article] [PubMed] [Google Scholar]
- 32.Ávila F. J., Del Barco O., Bueno J. M., “Polarization dependence of aligned collagen tissues imaged with second harmonic generation microscopy,” J. Biomed. Opt. 20(8), 86001 (2015). [DOI] [PubMed] [Google Scholar]
- 33.Ávila F. J., del Barco O., Bueno J. M., “Quantifying external and internal collagen organization from Stokes-vector-based second harmonic generation imaging polarimetry,” J. Opt. 19(10), 105301 (2017). [Google Scholar]
- 34.Peli E., “Contrast in complex images,” J. Opt. Soc. Am. A 7(10), 2032–2040 (1990). [DOI] [PubMed] [Google Scholar]
- 35.Bueno J. M., Vohnsen B., “Polarimetric high-resolution confocal scanning laser ophthalmoscope,” Vision Res. 45(28), 3526–3534 (2005). [DOI] [PubMed] [Google Scholar]
- 36.Hunter J. J., Cookson C. J., Kisilak M. L., Bueno J. M., Campbell M. C., “Characterizing image quality in a scanning laser ophthalmoscope with differing pinholes and induced scattered light,” J. Opt. Soc. Am. A 24(5), 1284–1295 (2007). [DOI] [PubMed] [Google Scholar]
- 37.Jalbert I., Stapleton F., Papas E., Sweeney D. F., Coroneo M., “In vivo confocal microscopy of the human cornea,” Br. J. Ophthalmol. 87(2), 225–236 (2003). [DOI] [PMC free article] [PubMed] [Google Scholar]
- 38.Bueno J. M., Gualda E. J., Giakoumaki A., Pérez-Merino P., Marcos S., Artal P., “Multiphoton microscopy of ex vivo corneas after collagen cross-linking,” Invest. Ophthalmol. Vis. Sci. 52(8), 5325–5331 (2011). [DOI] [PubMed] [Google Scholar]
- 39.Zoumi A., Yeh A., Tromberg B. J., “Imaging cells and extracellular matrix in vivo by using second-harmonic generation and two-photon excited fluorescence,” Proc. Natl. Acad. Sci. U.S.A. 99(17), 11014–11019 (2002). [DOI] [PMC free article] [PubMed] [Google Scholar]
- 40.Shen M., Zhao J., Zeng H., Tang S., “Calibrating the measurement of wavelength-dependent second harmonic generation from biological tissues with a BaB2O4 crystal,” J. Biomed. Opt. 18(3), 031109 (2013). [DOI] [PubMed] [Google Scholar]
- 41.Hall G., Tilbury K. B., Campbell K. R., Eliceiri K. W., Campagnola P. J., “Experimental and simulation study of the wavelength dependent second harmonic generation of collagen in scattering tissues,” Opt. Lett. 39(7), 1897–1900 (2014). [DOI] [PMC free article] [PubMed] [Google Scholar]
- 42.Kampik D., Ralla B., Keller S., Hirschberg M., Friedl P., Geerling G., “Influence of corneal collagen crosslinking with riboflavin and ultraviolet-a irradiation on excimer laser surgery,” Invest. Ophthalmol. Vis. Sci. 51(8), 3929–3934 (2010). [DOI] [PubMed] [Google Scholar]
- 43.Lombardo G., Micali N. L., Villari V., Serrao S., Lombardo M., “All-optical method to assess stromal concentration of riboflavin in conventional and accelerated UV-A irradiation of the human cornea,” Invest. Ophthalmol. Vis. Sci. 57(2), 476–483 (2016). [DOI] [PubMed] [Google Scholar]


