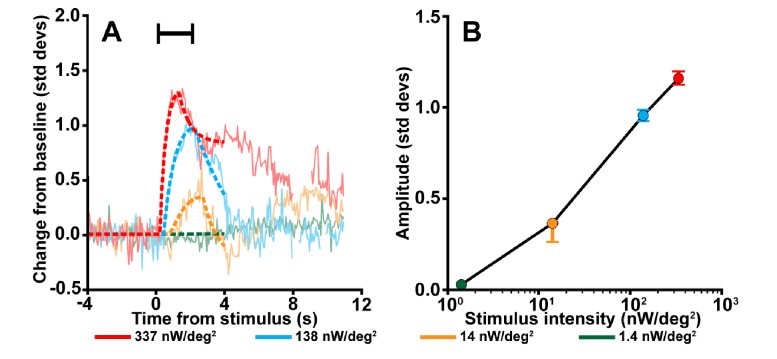
Fig. 5.
The cone reflectance response increases with stimulus irradiance. A) The reflectance response as a function of time for four stimulus intensities, overlaid with piecewise function fits (dotted lines; Formula 3). The reflectance response amplitude was extracted from each function by subtracting the mean prestimulus value from the peak fit value. As the intensity of the stimulus increased, the amplitude of the response also increased. Moreover, a more intense stimulus appeared to cause the peak of the intrinsic response to occur earlier in time with a steeper response slope. Stimulus duration indicated by the black bar. (B) The reflectance response amplitudes from (A) as a function of stimulus intensity. Data shown are from subject 11015 using 550 nm stimuli. Error bars delineate the 5th through the 95th percentile of the bootstrapped values.

