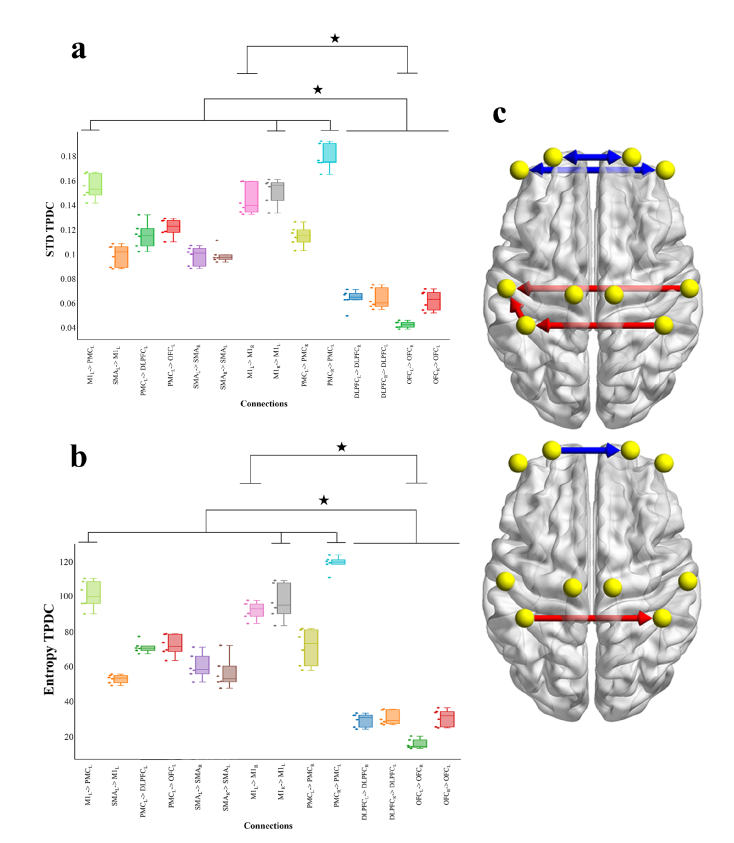
Fig. 6.
Standard deviation and entropy of the TPDC results with Box-plot, individual values and brain representation. Box-plots in a) and b) reflect median, quartile and dots of individuals values for each subject. X-axis represents connections. Stars indicate Anova statistical significance at p = 0.05. a) STD TPDC. b) Entropy TPDC. c) Representation for both STD and Entropy of statistical significance on brain surfaces (differences are represented between red and blue connections).

