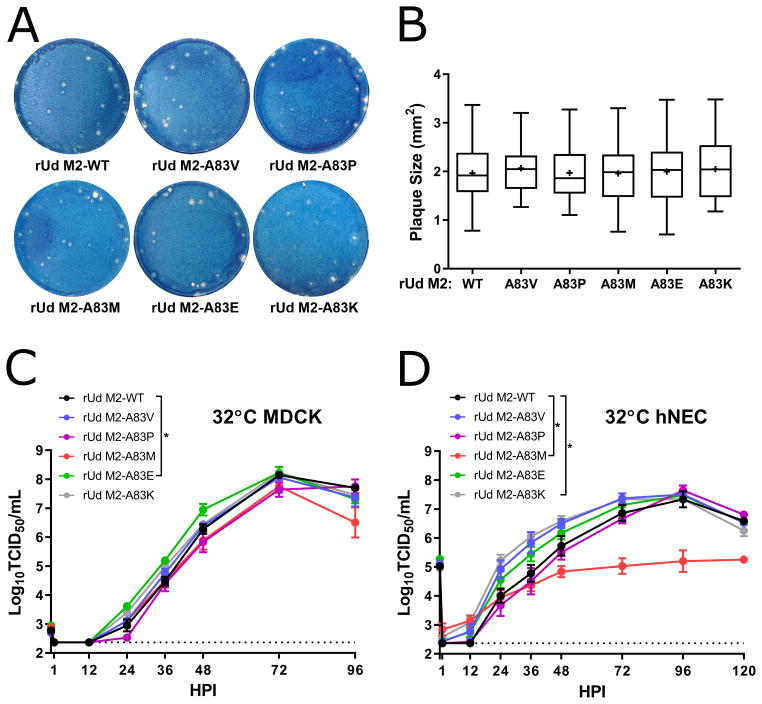
Figure 2. Replication of M2-83 mutants in MDCK cells and hNEC cultures.
(A) Plaque assays performed with indicated virus on MDCK cells. (B) Quantification of plaque diameter from 34–64 individual plaques per virus identified from 2–3 independent experiments. *p < 0.05. No conditions were statistically significant compared to rUd M2-WT. Low MOI multistep growth curves performed on (C) MDCK cells or (D) hNECs with the indicated viruses at 32°C. Data are pooled from two independent replicates each with n = 3 wells per virus (total n = 6 wells per virus). *p < 0.05 compared to rUd M2-WT (two-way ANOVA with Dunnett’s posttest). In (C) no time points were significantly different while in (D) rUd M2-A83M (48, 72, 96, and 120 HPI), rUd M2-A83K (24, 36, and 48 HPI) showed differences. Dotted line indicates limit of detection.

