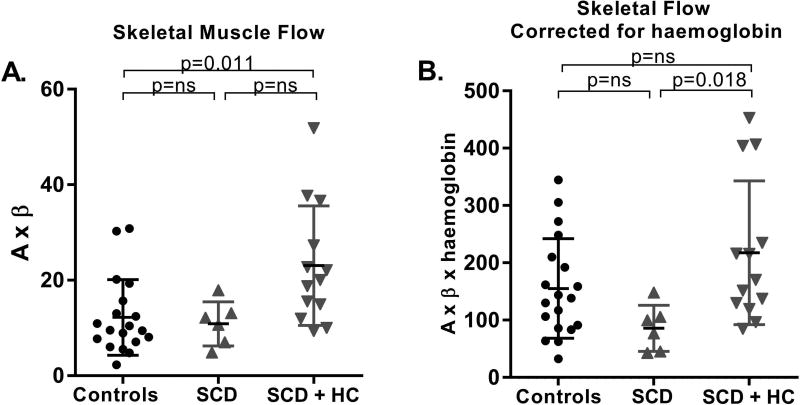
Figure 3. Skeletal Muscle Microvascular Flow.
A. Resting contrast-enhanced ultrasound-derived skeletal muscle flow data is shown in controls, SCD patients not on HC and SCD patients on HC therapy. B. Skeletal muscle flow normalized to haemoglobin levels is shown in all three groups. HC: hydroxycarbamide; ns: not significant; SCD: sickle cell disease.

