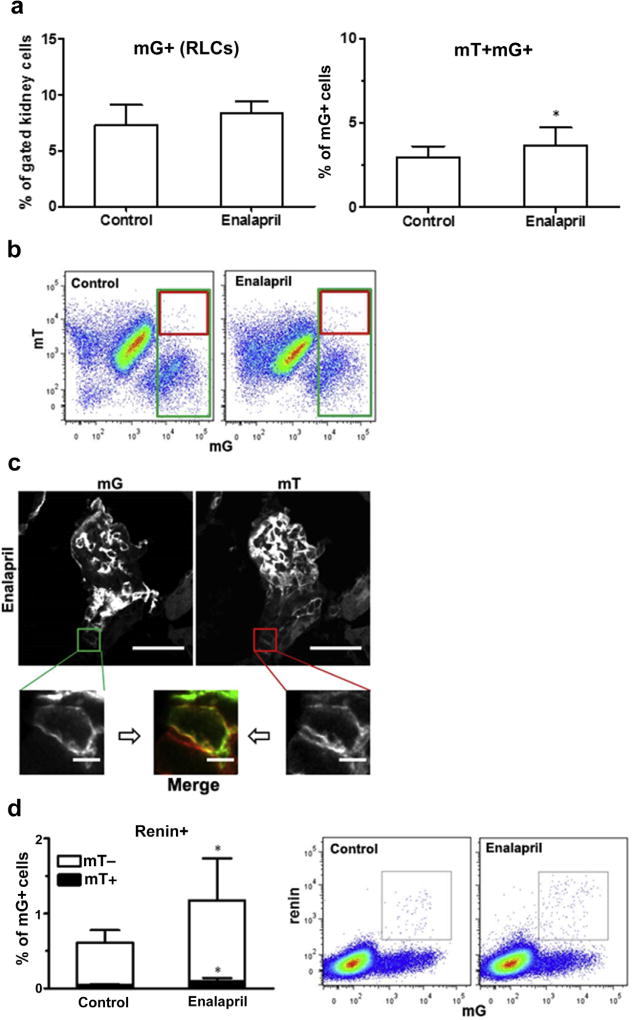
Figure 7. Neogenesis of renin lineage cells (RLCs) in the mouse kidney after enalapril treatment.
Mice were treated with the angiotensin-converting enzyme inhibitor enalapril (10 mg/kg for 7 days) to stimulate renin production. (a) Quantification of RLCs (mG+, left panel) and de novo differentiated RLCs (mT+mG+, right panel) in the kidneys of control (untreated) and enalapril-treated mice. (b) Representative flow cytometric analyses of kidneys from control (left panel) and enalapril-treated animals (right panel). (c) Representative confocal images of de novo differentiated RLCs (mT+mG+) in the kidneys of enalapril-treated mice (images from control animals are presented in Figure 5e). (d) Quantification of renin-positive RLCs and their distribution to de novo differentiated (mT+) and long-lived (mT−) subpopulations of RLCs (mG+) in the kidneys of control (untreated) and enalapril-treated mice (left panel), with representative flow cytometric analyses (middle and right panels). Bar = 20 µm (or 5 µm in zoomed images). Data are presented as mean ± SD; n = 14 per group; *P < 0.05 versus controls (Student unpaired t-test). To optimize viewing of this image, please see the online version of this article at www.kidney-international.org.

